Download

1 / 89
980 likes | 1.55k Views
Explore the principles of ultrasound, sound waves, energy, power, intensity, wavelength, frequency, and speed in this informative lecture by Mark Wilson, a Radiotherapy Physicist at Queen’s Centre for Oncology.

E N D
FRCR Physics Lectures The Physics of Diagnostic Ultrasound Mark Wilson Radiotherapy Physicist, Queen’s Centre for Oncology
Session 1 Overview Session Aims: Introduction to sound waves and their characteristics Define Ultrasound Basic principles of image formation Describe the four main types of ultrasound interactions with matter
Wave Motion • Waves transfer energy from one location to another • Waves can be broadly described as either “Transverse” or “Longitudinal”
Propagation of Sound • Sound waves are mechanical pressure waves (longitudinal) which propagate through a medium by compression and rarefaction of the particles • As a sound pressure wave propagates through the medium, particles in regions of high pressure will be pushed together (compression) and particles in regions of low pressure will be pulled apart (rarefaction)
Propagation of Sound • Rarefaction follows compression as the compressed particles transfer their energy to adjacent particles • The compression (and subsequent rarefaction) continues to travel forward through the medium as the energy is transferred between particles
Power and Intensity Power, P p Intensity, I p2 • A sound wave transports Energy through a medium from a source. Energy is measured in joules (J) • The Power, P,produce by a source of sound is the rate at which it produces energy. Power is measured in watts (W) where 1 W = 1 J/s • The Intensity, I,associated with a sound wave is the power per unit area. Intensity is measured in W/m2 • The power and intensity associated with a wave increase with the pressure amplitude, p
Wavelength, Frequency and Speed • Waves are characterised by their wavelength, frequency and speed • The Wavelength, , is the distance between consecutive peaks or other similar points on the wave. • The Frequency, f, is the number of oscillations per second • Frequency is measured in Hertz (Hz) where 1 Hz is one oscillation per second.
Wavelength, Frequency and Speed c = f c = B / • The Speed of sound, c, is the distance travelled by the wave per unit timeand is equal to the wavelength multiplied by the frequency • The speed of sound is dependent on the medium through which it travels and varies greatly in different materials • The speed of the wave is determined by the bulk modulus, B, (measure of stiffness) and the density, , (mass per unit volume) of the medium • Highly compressible media (low B), such as air, has a low speed of sound – 330 m/s • Less compressible media, such as bone, has a higher speed of sound – 4080 m/s
Wavelength, Frequency and Speed = c / f The frequency of a sound wave is unaffected by changes in the speed of the wave as it propagates through different media Therefore, the wavelength changes as the wave travels through different media Wavelength increases with an increase in wave speed Higher frequency sound waves have a shorter wavelength
Ultrasound • The term “Ultrasound” refers to sound waves of such a high frequency that they are inaudible to humans • Ultrasound is defined as sound waves with a frequency above 20 kHz • Ultrasound frequencies in the range 3-15 MHz are typically used for diagnostic imaging purposes • Medical diagnostic ultrasound uses ultrasound waves and the acoustic properties of the tissues in the body to produce an image
Ultrasound The use of ultrasound in medicine began shortly after the 2nd World War Dr. Karl Theodore Dussik’s work on transmission ultrasound investigation of the brain in 1942 (Austria) was the first published work on medical ultrasound Ultrasound was first developed for clinical purposes in 1956 in Glasgow Obstetrician Ian Donald and engineer Tom Brown developed the first prototype systems based on an instrument used to detect industrial flaws in ships They perfected its clinical use, and by the end of the 1950s, ultrasound was routinely used in Glasgow hospitals Commercial systems became available in the mid-1960’s
Pulse Echo Principal Tissue 1 Tissue 2 Tissue 3 US Pulse Transducer Reflected Echoes • A short ultrasound pulse is delivered to the tissues, and where there are changes in the acoustic properties of the tissue, a fraction of the pulse is reflected (an echo) an returns to the source (pulse-echo principal) • Collection of the echoes and analysis of their amplitudes provides information about the tissues along the path of travel
Pulse Echo Principal The ultrasound pulse will travel at the speed of sound and the time between the pulse emission and echo return will be known. Therefore, the depth, d, at which the echo was generated can be determined and spatially encoded in the depth direction. Distance (D) = speed (c) x time (t) 2d = c t Tissue 1 Tissue 2 Tissue 3 US Pulse Transducer Reflected Echoes
Tomographic Imaging Repeating this process many times with incremental changes in pulse direction allow a volume to be sampled and a tomographic image to be formed. i.e. A tomographic image is formed from a large number of image lines, where each line in the image is produced by a pulse echo sequence Transducer
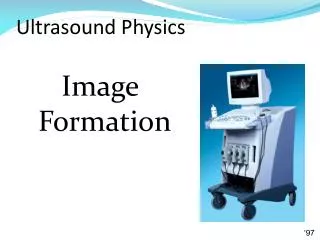
B-Mode Image A B-mode image is a cross-sectional image representing tissues and organ boundaries within the body Constructed from echoes which are generated by reflection of US waves at tissue boundaries, and scattering from small irregularities within tissues Each echo is displayed at a point in the image which corresponds to the relative position of its origin within the body The brightness of the image at each point is related to the strength (amplitude) of the echo B-mode = Brightness mode
B-Mode Image – How Long Does it Take? 1. Minimum time for one line = (2 x depth) / speed of sound = 2D / c seconds 2. Each frame of image contains N lines 3. Time for one frame = 2ND / cseconds E.g. D = 12 cm, c = 1540 m/s, Frame rate = 20 frames per second Frame rate = c / 2ND N = c / (2D x Frame rate)= 320 lines (poor - approx half of standard TV) Additional interpolated lines are inserted between image lines to boost image quality to the human eye 4. Time is very important!!!
Time Gain Compensation (TGC) Thedeeper the source of echo Smaller signal intensity Due signal attenuation in tissue and reduction of the initial US beam intensity by reflections Operator can TGC use to artificially ‘boost’ the signals from deeper tissues to compensate for this (like a graphic equaliser)
M-Mode Image Time Transducer at fixed point Depth Can be used to observe the motion of tissues (e.g. Echocardiography) Image the same position (one image line) repeatly. One direction of display is used to represent time rather than space
Basic Principles of Image Formation M-Mode Image of Mitral Valve
Interactions with Matter • Ultrasound interactions with matter are determined by the acoustic properties of the media through which it propagates • As Ultrasound energy propagates through a medium, interactions include: • Reflection • Refraction • Scatter • Attenuation / Absorption
Reflection Incident Reflection (echo) Z1 Z2 Transmission Reflection (specular reflection) occurs at tissue boundaries where there is a difference in the acoustic impedance, Z, of the two tissues When the incident ultrasound wave is perpendicular to the boundary, a fraction of it’s energy is reflected (an echo) directly back towards the source The remaining energy is transmitted into the second tissue and continues in the initial direction
Reflection – Acoustic Impedance m B m B m m B Soundwave The acoustic impedance of a material is a measure of the response of the particles of the medium to a wave of given pressure (e.g. resistance) The acoustic impedance of a medium is again determined by the bulk modulus, B, (measure of stiffness) and the density, , (mass per unit volume) of the medium Consider a row of masses (molecules) linked by springs (bonds) A sound wave can be propagated along the row of masses by giving the first mass a momentary “push” to the right This movement is coupled to the second mass by the spring
Reflection – Acoustic Impedance m b m b m m b Soundwave • Small masses (m) model a material of low density linked by weak springs of low stiffness (b) • A given pressure is applied momentarily to the first small mass m • The small mass is easily accelerated to the right and its movement encounters little resistance from the weak spring b • This material has a low acoustic impedance, as particle movements are relatively large in response to a given applied pressure
Reflection – Acoustic Impedance M B M B M M B Soundwave • Large masses (M) model a material of high density linked by springs of high stiffness (B) • In this case, the larger masses M accelerate less in response to the applied pressure • Their movements are further resisted by the stiff springs B • This material has a high acoustic impedance, as particle movements are relatively small in response to a given applied pressure
Reflection – Acoustic Impedance = density (kg/m3) z = B B = bulk modulus (kg/m-s2) = density (kg/m3) z = c c = speed of sound (m/s) The acoustic impedance, Z, of a material is given by Recall that the speed of sound, c = B / B = c2 Therefore,
Reflection – Acoustic Impedance There are relatively small differences in acoustic impedance for “soft tissues”
Reflection ( ) 2 Z2 – Z1 Ir R = = Ii Z1 + Z2 Ii Z1 Ir Z2 It • The fraction of ultrasound intensity reflected at an interface is given by the intensity reflection coefficient, R • The fraction of ultrasound energy reflected depends on the difference between the Z values of the two materials • R increases rapidly as the difference in Z increases
Reflection It T = = 1 - R Ii Ii Z1 Ir Z2 It • The fraction of ultrasound intensity transmitted at an interface is given by the intensity transmission coefficient, T • Ultrasound imaging is only possible when the wave propagates through materials with similar acoustic impedances – only a small fraction of energy is reflected and the rest is transmitted
Reflection At soft tissue – soft tissue interfaces 1-2% of the ultrasound intensity is reflected At soft tissue – air interfaces 99% of the incident intensity is reflected • At soft tissue – air or soft tissue – bone interfaces, a large proportion of the incident intensity is reflected, making anatomy beyond such interfaces unobservable • Acoustic coupling gel is used between the face of the ultrasound transducer and skin to eliminate air pockets
Reflection Reflection (echo) Incident θi θr Z1 Z2 θt Transmission (refraction) When the wave is not incident perpendicular to the interface, non-normal incidence, the reflected angle is equal to the incident angle (i.e. θr = θi) Echoes are directed away from the source of ultrasound and may be undetected The transmitted wave does not continue in the incident direction (i.e. θt ≠ θi) The change in direction is described by Refraction
Refraction Reflection (echo) Incident θi θr Z1 =1c1 Z2 =2c2 sin θt c2 = c1 sin θi θt Transmission (refraction) Refraction describes the change in direction of the transmitted ultrasound wave at a tissue interface when the wave is not incident perpendicular to the interface The angle of refraction, θt , is determined by the speed of sound change that occurs as the wave crosses the boundary The angle of refraction is related to the angle of incidence by Snell’s law:
Refraction When c2> c1 the angle of transmission is greater than the angle of incidence c2< c1 c2> c1 Incident Reflection (echo) Incident Reflection (echo) θi θr θi θr c1 c1 c2 c2 θt θt Transmission (refraction) Transmission (refraction) When c2< c1 the angle of transmission is less than the angle of incidence
Refraction c2> c1 Reflection (echo) Incident θi θr c1 c2 θt Transmission (refraction) A condition known as total reflection occurs when c2> c1 and the angle of incidence exceeds an angle called the critical angle , θc When θi = θc the sound wave does not continue into the second medium but travels along the boundary The critical angle is calculated by setting θt = 90o in Snell’s law, giving sinθc = c1/c2
Refraction Displayed in image here Anatomical feature here Refraction does not occur when the speed of sound is the same in the two media, or when a sound wave is incident perpendicular to the interface This “straight-line” propagation is assumed by the ultrasound system during signal processing When refraction does occur, this can result in image artefacts due to the misplacement of anatomy in the image
Scattering • Reflection occurs at large tissue interfaces, such as those between organs, where there is a change in acoustic impedance • These large specular reflectors represent a “smooth” boundary where the size of the boundary is much larger than the wavelength of the incident ultrasound wave • Within most tissues and organs there are many small-scale variations in acoustic properties which constitute small-scale reflecting particles that are similar in size or smaller than the wavelength of the ultrasound • These small non-specular reflectors represent a “rough” surface and give rise to acoustic scattering within the insonated tissues
Scattering Scattering from non-specular reflectors reflects sound in all directions Scattering is a weak interaction in that the amplitude of the returning echoes are significantly weaker than those from tissue boundaries Intensities of the returning echoes from non-specular reflectors within the tissue are not greatly dependent on beam direction, unlike specular reflectors The scattering pattern is characteristic of the particle size and gives rise to tissue or organ signatures that lead to a specific speckle or textured appearance in the ultrasound image
Scattering Non-specular Reflection Incident Z1 Z2 Transmission (refraction) Tissue boundary interactions can also give rise to scatter Specular reflection assumes a “smooth” interface, where the wavelength of the ultrasound is much greater than the structural variations of the interface With higher frequency ultrasound waves, the wavelength becomes smaller and the interface no longer appears “smooth” Returning echoes are diffusely scattered (non-specular reflection) and only a fraction of the reflected intensity returns to the transducer Scattering from non-specular reflectors increases with ultrasound frequency, but specular reflection is relatively independent
Attenuation As an ultrasound wave propagates through a tissue, the energy of the wave reduces with the distance travelled Attenuation describes the reduction in beam intensity with distance travelled and is primarily caused by scattering and tissue absorption of the incident beam The attenuation coefficient,, (in units dB/cm) is the relative intensity loss per cm of travel for a given tissue The attenuation coefficient varies widely between different tissues and media The attenuation coefficient for a given tissue varies with ultrasound frequency; Attenuation increases linearly with increasing frequency For “soft tissue”, the attenuation coefficient can be approximated as 0.5 (dB/cm)/MHz
Attenuation 1 I = Ioe- d Io = Initial intensity Relative Intensity, I Low frequency 0.5 High frequency Distance travelled, d Ultrasound beam intensity reduces exponentially due to attenuation, according to:
Attenuation 1 Relative Intensity, I Low frequency 0.5 High frequency Distance travelled, d The ultrasound half-value thickness (HVT) is the thickness of tissue necessary to attenuate the incident intensity by 50% (or 3 dB) The HVT decreases as the frequency increases When penetration to deeper structures is important, lower frequency ultrasound transducers are required
Attenuation Decibel Notation Relative Intensity (dB) = 10 log10 (I2 / I1) Where I1 = initial intensity, I2 = final intensity In soft tissues a significant proportion of energy loss (attenuation) is due to tissue absorption Absorption is the process by which ultrasound energy is converted into heat energy in tissue Energy lost through absorption does not contribute to image formation Ultrasound attenuation is usually expressed in terms of decibels (dB)