Classification
Classification. An Example (from Pattern Classification by Duda & Hart & Stork – Second Edition, 2001). A fish-packing plant wants to automate the process of sorting incoming fish according to species


Classification
E N D
Presentation Transcript
An Example(from Pattern Classification by Duda & Hart & Stork – Second Edition, 2001)
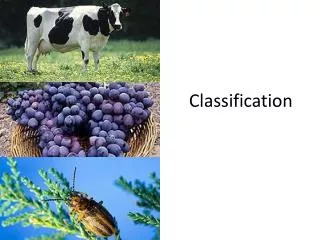
A fish-packing plant wants to automate the process of sorting incoming fish according to species • As a pilot project, it is decided to try to separate sea bass from salmon using optical sensing
Features to explore for use in our classifier • Length • Lightness • Width • Position of the mouth • …
Preprocessing: Images of different fishes are isolated from one another and from background; • Feature extraction: The information of a single fish is then sent to a feature extractor, that measure certain “features” or “properties”; • Classification: The values of these features are passed to a classifier that evaluates the evidence presented, and build a model to discriminate between the two species
Domain knowledge: a sea bass is generally longer than a salmon • Feature: Length • Model: Sea bass have some typical length, and this is greater than the length of a salmon
Classification rule: If Length >= l* then sea bass otherwise salmon • How to choose l* ? • Use length values of sample data (training data)
Histograms of the length feature for the two categories Leads to the smallest number of errors on average We cannot reliably separate sea bass from salmon by length alone!
New Feature: Average lightness of the fish scales
Histograms of the lightness feature for the two categories Leads to the smallest number of errors on average The two classes are much better separated!
Classifying a sea bass as salmon costs more. Thus we reduce the number of sea bass classified as salmon. Histograms of the lightness feature for the two categories Our actions are equally costly
In Summary: The overall task is to come up with a decision rule (i.e., a decision boundary) so as to minimize the cost (which is equal to the average number of mistakes for equally costly actions).
No single feature gives satisfactory results • We must rely on using more than one feature • We observe that: sea bass usually are wider than salmon • Two features:Lightness and Width • Resulting fish representation:
Decision rule:Classify the fish as a sea bass if its feature vector falls above the decision boundary shown, and as salmon otherwise Should we be satisfied with this result?
Options we have: • Consider additional features: • Which ones? • Some features may be redundant (e.g., if eye color perfectly correlates with width, then we gain no information by adding eye color as feature.) • It may be costly to attain more features • Too many features may hurt the performance! • Use a more complex model
All training data are perfectly separated Should we be satisfied now?? • We must consider: Which decisions will the classifier take on novel patterns, i.e. fishes not yet seen? Will the classifier suggest the correct actions? This is the issue of GENERALIZATION
Generalization • A good classifier should be able to generalize, i.e. perform well on unseen data • The classifier should capture the underlying characteristics of the categories • The classifier should NOT be tuned to the specific (accidental) characteristics of the training data • Training data in practice contain some noise
As a consequence: We are better off with a slightly poorer performance on the training examples if this means that our classifier will have better performance on novel patterns.
The decision boundary shown may represent the optimal tradeoff between accuracy on the training set and on new patterns How can we determine automatically when the optimal tradeoff has been reached?
Tradeoff between performance on training and novel examples error Generalization error Error on training data Optimal complexity Complexity of the model Evaluation of the classifier on novel data is important to avoid overfitting
Summarizing our example: • Classification is the task of recovering (approximating) the model that generated the patterns (generally expressed in terms of probability densities) • Given a new vector of feature values, the classifier needs to determine the corresponding probability for each of the possible categories
Performance evaluation: • Error rate: the percentage of new patterns that are assigned to the wrong class • Risk: total expected cost Can we estimate the lowest possible risk of any classifier, to see how close ours meets this ideal? Bayesian Decision Theory: considers the ideal case in which the probability structure underlying the classes is known perfectly. This is rarely true in practice, but it allows to determine the optimal classifier, against which we can compare all classifiers.
Class-conditional probability density functions: represent the probability of measuring a certain value x given that the pattern is in a certain class