Download
1 / 11
120 likes | 165 Views
Study on flood modeling and vulnerability assessment in Ialomita River Basin, focusing on Dridu Dam failure scenario and comparison of 1D and 2D models, using statistical approach for vulnerability assessment.

E N D
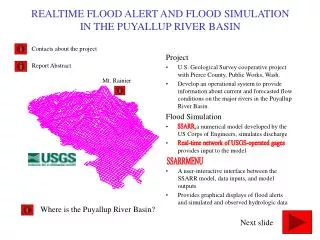
487 - Flood modelling and vulnerability assessment in Ialomita river basin Eng. Maria Cheveresan, PhD maria.cheveresan@utcb.ro May 2012 BALWOIS, Ohrid, MACEDONIA
STUDY AREA Prahova river Ialomita river Ialomita river Dridu dam
DRIDU DAM FAILURE The worst scenario = one of the front tile of the dam structure would slide downstream flood wave with a maximum discharge of 2361 m3/s (almost 0,1% maximum discharge)Dridu – Tandarei river strecth (aprox 180 km) 1D model setup 2D model setup • cross sections • DTM • Land use CLC 2000 • Aerial images • Rating curves in 4 hydrometric stations • Flood wave due to Dridu failure - DTM fix grid 40m x 50m - Boundary conditions - Drying (0.02 m)/flooding (0.03 m) depths conditions - Initial water level on the modeled area - Eddy viscosity – 0.04 m2/s - Roughness coefficients Manning M between 20-40 m1/3/s
COMPARISON BETWEEN 1D AND 2D MODEL ON DRIDU TANDAREI RIVER STRETCH Results from the 1D model Results from the 2D model
COMPARISON BETWEEN 1D AND 2D MODEL ON DRIDU TANDAREI RIVER STRETCH Differences in water depths
STATISTICAL APPROACH IN VULNERABILITY ASSESMENT • Qualitative information about the vulnerable objects in the analyzed area. • Only 10% of potential vulnerable assets will produce real damages • Population density from National Insititute of Statistics (66,6 inhabitants/km2 in 2002) • Statistical indicator for assessing the number of vulnerable houses ( 6,4 houses/hectare )
GIS EXTENTION TOOL FOR VULNERABILITY ASSESMENT Tool interface
RESULTS OF THE VULNERABILITY ASSESMENT IN CASE OF DRIDU FAILURE NLZA = Population density x total area of vulnerable settlements ( 900 inhabitants ) NC3 = 4,5% *NLZA = 41 children NP70 = 5,4% * NLZA = 49 senior persons NCA = total area of vulnerable settlements x 6,4 houses = 864 houses NDDZA=3 (Urziceni, Manasia and Cosambesti landfill deposits )
CONCLUSIONS • Water depth in flood prone area for 2D lower than for 1D • Discharges obtained in 2D 28% lower than in 1D • Propagation time in case of 2D is 40% higher than in case of 1D • 2D models should be used for vulnerability and risk assesment • Still 1D models can be used for the statistical vulnerability assesment • If detailed and/or sufficient data is missing statistical apporach offers a good vulnerability assesment with extremely low costs • This statistical approach can be used as preliminary analysis for further detailed vulnerability and risk assessment in some needed areas