Download
1 / 26
260 likes | 311 Views
Develop an operational system providing current & forecasted flow conditions in Puyallup River Basin. Utilizes flood simulation model to create alerts and graphical displays. Contact details and project overview included.

E N D
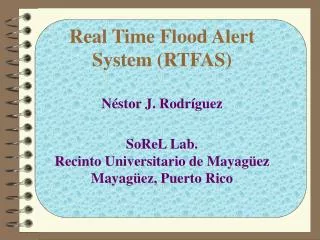
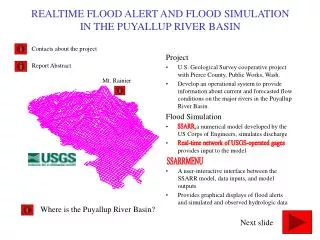
REALTIME FLOOD ALERT AND FLOOD SIMULATION IN THE PUYALLUPRIVER BASIN Contacts about the project Report Abstract Project • U.S. Geological Survey cooperative project with Pierce County, Public Works, Wash. • Develop an operational system to provide information about current and forecasted flow conditions on the major rivers in the Puyallup River Basin. Flood Simulation • a numerical model developed by the US Corps of Engineers, simulates discharge • provides input to the model • A user-interactive interface between the SSARR model, data inputs, and model outputs • Provides graphical displays of flood alerts and simulated and observed hydrologic data Mt. Rainier SSARR, Real-time network of USGS-operated gages SSARRMENU Where is the Puyallup River Basin? Next slide
Contacts Mark Mastin, project chief and author of the report, is a hydrologist with the U.S.Geological Survey/Water Resources Division at the Washington District office in Tacoma, Wash. 253-428-3600 x2609 U.S.Geological Survey 1201 Pacific Ave., Suite 600 Tacoma, WA 98402 Email: mcmastin@usgs.gov Office Home Page: http://wa.water.usgs.gov/ Randy Brake, is a river systems engineer with Pierce County River Improvement, a division of the Pierce County Water Programs within the Public Works department, and the primary user of SSARRMENU. 253-798-4651 Pierce County Water Programs River Improvement Division 9315 Gravelly Lake Drive S.W. Lakewood, WA 98499 email: RBRAKE@CO.PIERCE.WA.US Return
Real-Time Flood Alert and Simulation of River Flood Discharges in the Puyallup River Basin, WashingtonBy M.C. MastinU.S. Geological Survey Water-Resources Investigations Report ABSTRACT In a cooperative project, Pierce County and the U.S. Geological Survey have developed an operational tool called the Puyallup Flood-Alert System to alert users of impending floods. The system acquires real-time meteorological and hydrological data to make real-time flood simulations for the major rivers in the Puyallup River Basin and provides a flood-alert computer display. The system consists of a network of U.S. Geological Survey-operated river discharge and stage, precipitation and temperature gages, a numerical watershed and flow-routing model, and a computer interface. The Streamflow Synthesis and Reservoir Regulation (SSARR) numerical watershed and flow-routing model is the heart of the system that makes real-time and forecast simulations based on real-time data from the gaging network and precipitation and temperature forecasts from the National Weather Service. The watershed model was calibrated to four storms in water years 1995 and 1996 and validated (runoff parameters held constant) with four storms in the 1996 and 1997 water years. Two-thirds of the simulated peak discharges for the calibration storms were within 36 percent of the observed peak discharge and two-thirds of the 5-day runoff totals were within 17 percent. For the validation storms, two-thirds of the simulated peak discharges were within 30 percent of the observed peak discharges and two-thirds of the 5-day runoff totals were within 24 percent. SSARRMENU, a customized user interface for the Puyallup Flood-Alert System, is the central software that provides a graphical display of flood-alerts, model input and output, makes retrievals of hydrologic and meteorological data from the U. S. Geological computer, and makes both backup- and storm-mode flood simulations. With SSARRMENU operating on their computer, Pierce County has an increased ability to evaluate current and near-future floods and to efficiently allocate its resources to potential trouble spots. Return
Mt Rainier as view from Tacoma, Wash. Mt. Rainier is the highest (14,410 feet) mountain in the Cascade Mountain Range. During the winter when floods generally occur, much of the precipitation on the mountain is in the form of snow and contributions to flood runoff is minimal. During the summer, however, snow and glacier melt from the mountain are important contributions to maintaining stream flows in the White River and the main stem of the Puyallup River. Return
Streamflow Synthesis and Reservoir Routing (SSARR) SSARR consists of a numerical watershed model and a streamflow routing model. Streamflow is simulated in subbasins from precipitation and temperature inputs. The snowband version of SSARR, which was used in the Puyallup River Basin model, divides subbasins into elevation zones and simulates snow accumulation and melt. A storage-routing model routes flows through channel and reservoirs under free-flow and controlled-flow conditions. SSARR was developed by the North Pacific Division of the U.S. Corps of Engineers and is used in operational river forecasting and river management of the Columbia River. Flow chart of simulated runoff from a snowband Schematic diagram of the SSARR network in the Puyallup River Basin model Return
Schematic DiagramSchematic of the network of subbasins, channel reaches, reservoirs, and summing points used in the Puyallup River Basin model, Washington Return
Flow chart Flow chart of the simulated runoff from a snowband for the Puyallup River Basin model, Washington Return
PUYALLUP RIVER BASIN Return to first screen
Generalized flowpaths of field data to Pierce County and the SSARRMENU program (satellite) Return More about SSARRMENU S S A R R M E N U Pierce County Public Works
Opening Screen of SSARRMENU This is the opening screen of the SSARRMENU program showing Menu Items, the Alert Map, and Model Run Information Window Menu Items Alert Map Model Run Information Window Return
Model Run Information Window Model runs should be started when initial conditions of previous model runs have been stored so that continuity is maintained between model runs. The Model Run Information Window provides the times when initial conditions have been stored and information on the last model run. Model Run Times Also shown is the Model Run Times dialog box that allows users to enter the beginning and ending times of the next model run and select from the two time-step options. These two windows in SSARRMENU are examples of how the interface facilitates the running of the SSARR model by the user. Return
Schematic of Menu Items for SSARRMENU (click on one of these buttons for example plots or more information) Top-level menu items that are visible on the menu bar of the opening screen Menu items activated after first selecting the top-level menu item Return
Pick Plot From the Data/Pick Plot menu item, hydrographs of simulated and observed discharge are produced by ‘clicking’ on the stations on the Alert Map. In this example, discharge is plotted for the Puyallup River at Orting stream gage during the February 1996 peak of record at this site. Return
Precipitation Plots The user is allowed to view the precipitation data prior to the data conversion and select those stations with good data to be used in the model runs. SSARRMENU automatically computes subbasin precipitation time series based on the user-selected list of stations. In this example, three of the six precipitation stations in the basin are shown Return
Data Conversion/ Temperature Plot Before the data is converted from USGS-format to SSARR format, the user may choose to plot the temperature data and deselect those stations that may have bad data. Only the selected stations are used in the model runs. Return
Adjust Model RunThis is an example of an ‘Adjust’ model run on the Upper Puyallup subbasin. This type of model run is generally made just prior to a forecast model run in order to begin the forecast model run with the simulated discharge in reasonably close agreement with the observed discharge Note in the upper hydrograph, that the simulated discharge is significantly less than the observed discharge at the end of the model run. The model is rerun for the same period using the SSARR model automatic adjust algorithm as seen in the lower hydrograph. In order to adjust the simulated discharge, the amount of precipitation was increased from 6.61 inches of precipitation in the unadjusted run to 8.48 inches in the adjusted run for the three-day time period. Click here to see the results of the Forecast model run that followed the Adjust model run Return
Forecast Model RunThis is an example of a forecast model run that was run after an adjust model run was made for the Upper Puyallup subbasin. Click here to see the adjust model run. The observed discharge and precipitation plot was added after the forecast model run was made when the data became available. Precipitation and temperature inputs for the forecast model run are provided by the National Weather Service at six-hour time steps. UPPER PUYALLUP SUBBASIN Return
SSARRMENU provides text files of simulated discharge for the user. Time code representing February 5, 1996 at 0800 hours for the first value in the row of eight values. The letter code in the column near the left side of this file is the SSARR time series code that identifies the data corresponding to it. Click on the button below for a listing of the SSARR time series codes used in the Puyallup River Basin model Simulated discharge, in cubic feet per second, from the Carbon River Subbasin on February 7, 1996 at 12:00 noon. Return
Time Series Codes used in the Puyallup River Basin ModelSUBBASINS BASIN PRECIP. FORECASTED TEMP. UPPUY Upper Puyallup River Subbasin UPPP STMP - Stampede PassLWPUY Lower Puyallup River Subbasin LPUP FTLT - Fort LewisUPWHT Upper White River Subbasin UPWPLWWHT Lower White River Subbasin LWHPSOPRE South Prairie Creek Subbasin SOPPCARBON Carbon River Subbasin CARPGRNWTR Greenwater River Subbasin GRNPOBSERVED PRECIPITATION OBSERVED TEMPERATUREBUCP - Buck Ck. Camp Met. Site #470118121330800 BUCT - Buck Creek Camp Met. SiteELEP - Puyallup R. at Electron, Sta. #1209200 ELET - Puyallup R. at ElectronSOPR - South Prairie Creek, Sta. #12095000 SPRT - So. Prairie Creek at So. PrairieCARB - Carbon R. nr. Fairfax, Sta. #12094000 CAYU - Cayuse Pass Snow PillowsWHTP - White River Canal, Sta. # 12099000 GNWP - Greenwater River at Greenwater, Sta. # 12097500SIMULATED DISCHARGE OBSERVED DISCHARGEUPPUY (basin outflow) ORTOBS - Puyallup R. nr. Orting, Sta. #12093500CARBON (basin outflow) CRFOBS - Carbon R. nr. Fairfax, Sta #12094000SOPRE (basin outflow) SOPOBS - South Prairie at South Prairie, Sta.#12095000GRNWTR (basin outflow) GRNOBS - Greenwater R. at Greenwater,Sta#12097500SUM1Q (summation point) WBCOBS - White R. blw. Clearwater, Sta. #12097850MMDQ(reservoir outflow) WNBOBS - White nr. Buckley (not available for realtime)CANAL (CANALB outflow) WCBOBS - White R. Canal at Buckley,Sta.#12099000 SUM2Q (summation point WBQOBS - White R. at Buckley #12100000TAPPSQ(reservoir outflow) LTDOBS - Lake Tapps Diversion, Sta. #12101100PUYSIM (REACH5 outflow) PUYOBS - Puyallup R. at Puyallup, Sta. #12101500PUYDIF (PUYBAL--difference between PUYOBS and REACH5) MCQOBS - addition of flows (#12099000 + #12100000) WCQOBS - subtraction of flows(#12097850 - #12097500)SIMULATED STAGE OBSERVED STAGEORSSIM (ORSSTG rating) ORSOBS - Puyallup R. nr. Orting, Sta. # 12093500CRSSIM (CRSSTG rating) CRSOBS - Carbon River at Orting, Sta. #12095690PASSIM (PASSTG rating) PASOBS - Puyallup at Alderton, Sta. #12096500MMDE MMDOBS - Forebay elevation, Mud Mtn. Lake, Sta. #1209800WASSIM (WASSTG rating) WASOBS - White River near Auburn , Sta. #12100496TAPPSE TAPOBS - Lake Tapps nr. Sumner, Sta. #12101000PUSSIM (PUSSTG rating) PUSOBS - Puyalllup R. at Puyallup, Sta. #12101500 Return
Water-Balance Plot Return
Precipitation PlotOne of two precipitation information plots from SSARRMENU for the Puyallup River Basin, Washington Return
SMI PLOTExample soil moisture index (SMI) plot from SSARRMENU for the Puyallup River Basin, Washington Soil Moisture Index is an index to the simulated moisture computed for each subbasin, measured in inches Return
SWE PLOTExample snow water equivalent (SWE) plot from SSARRMENU for the Puyallup River Basin, Washington Snow water equivalent is the simulated depth of water content contained in the snow pack, in inches Return
Threshold Values for Alert Status STATION ALERT REMARKS CAYUSE PASS NONE WHITE-AUBURN STAGE > 80.0 (PEAK MEAN DAILY STAGE = 79.77 (WY '95) LK.TAPPS DIV. NONE PUYALLUP-ALDERTON STAGE > 53.0 (PEAK MEAN DAILY STAGE = 52.56 WY'95) PUYALLUP-PUYALLUP DISCHARGE > 17,000 (PEAK MEAN DAILY Q = 15,400 WY'95) PUYALLUP-ORTING DISCHARGE > 4,000 (PEAK MEAN DAILY Q = 3,480 WY'95) CARBON-ORTING STAGE > 27.0 (PEAK MEAN DAILY STAGE = 26.56 WY'95) CARBON-FAIRFAX DISCHARGE > 3,500 (PEAK MEAN DAILY Q = 3,390 WY'95) MUD MTN INFLOW DISCHARGE > 7,090 (PEAK MEAN DAILY Q = 7,090 WY'95) MUD MTN LAKE STAGE > 1092.00 (PEAK STAGE = 1092.35 WY'95) WILLIAMS BRIDGE STAGE > 47.80 (2.0 FEET BELOW TOP OF LEFT BANK) SOUTH PRAIRIE DISCHARGE > 2,500 (PEAK MEAN DAILY Q = 1,970 WY'95) WHITE-BUCKLEY STAGE > 7.10 (1.0 FEET BELOW TOP OF LEFT BANK) GRNWTR-GRNWTR DISCHARGE > 1,300 (PEAK MEAN DAILY Q = 1,160 WY'95) BUCK CREEK PREC24 >3.0,PREC6HR >1.4 (2-yr,24hr = 3.0in;2-yr,6hr=1.4in) WHITE-CANAL NONE Return
Flood Alert Map View the threshold list Note the large red dots. These represent stations that are on alert, and in this example, three stations have exceeded pre-defined threshold values since the last data retrieval. Return