Download

1 / 17
170 likes | 183 Views
Explore the evolving landscape of American households, including the decline of traditional nuclear families, the rise of cohabitation and single-parent homes, and the impact on financial aid management. Discover key statistics, trends, and challenges in this comprehensive guide.

E N D
The Changing American Household Facts and Figures About Families In the U.S. and The Impact on Financial Aid Management
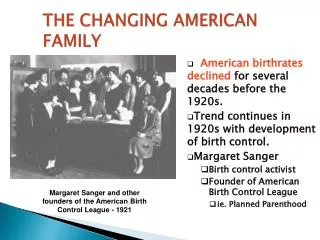
Soundbites • “The most common living arrangement in the United States consists of unmarried people and no children, which make up one-third of all households in 1998, double the percentage in 1972” • “…the traditional nuclear family—a married couple with children– made up 26% of households in 1998, down from 45% in 1972.” • “About half of children now live in a household with their original parents, down from nearly three-quarters of children…in 1972” • “Two-Parent Families Growing Scarcer – U.S. Study,” www.divorcereform.or/mel/a2parentscarce.html
New Family Snapshot • In 2000, first time ever that fewer than 25% of households consisted of traditional nuclear family—a married man and woman and their children • 23.5% vs. 45% in 1960 • Average household size declined to record low of 2.59 people in 2000 • Asian hh size remained steady since 1990 • Hispanic hh size only one to increase between 1970 and 1999 • Increasingly important factors: household formation, labor force participation, divorce and fertility rate Source: “Executive Summary: The Changing American Family,” Population Resource Center, www.prcdc.org/summaries/family/family.html
New Family Snapshot • Significant increase in median age for first time married men and women • Men: up from 24 to 27 since 1980 • Women: up from 22 to 25 since 1980 • Unmarried couples nearly doubled in 1990’s, with about one-third with children • Over a million cohabiting couples had at least one child Source: “Executive Summary: The Changing American Family,” Population Resource Center, www.prcdc.org/summaries/family/family.html
Cohabitation • Four percent of all households in 1994; only one percent of all households in 1970 • Increased by 72% in last decade, including same-sex and different-sex couples • As many as 10 million children of lesbian, gay and bisexual parents in U.S. • In 1996, 17% of children living with unmarried parent lived with a parent cohabiting with another adult
Percent of Children Born to Unmarried Parents Source: US Census figures cited from “Work and Family in America” Report, http://asweb.artsci.uc.edu/sociology/kunzctr/stats.htm.
Divorce • Fifty percent of first marriages end in divorce after an average of 11 years • 43% of marriages is a remarriage for at least one partner • Chance that remarriage will end in divorce is 60% • Divorces typically take one year and cost $15,000 • Average age at first divorce: Men 35, Women 33 • Average age at second divorce: Men 42, Women 39
Who Children Live With Source: US Census Bureau, Statistical Abstract of the United States: 2000, www.census.gov
Female-Headed Households • Single moms increased by 25% in the 1990s, compared to 6% increase in married households • In 1998, 84% of children in single parent homes lived with mom • Accounted for 12% of families with children in 1970 and 27% of families with children in 1996 • Contained 18% of population in poverty in 1959; 39% in 1995 • Median income, $26,164, is 37% lower than median for male-headed households
Male-Headed Households • In 1999, about 1.7 million single dad households • Single dad homes accounted for 5% of households with children in 1999 • Number of single dad households grew 62% between 1990 and 2000 • Median income higher than that of all households, $41,838 vs. $40,816
Family Income Trends Income in Thousands (Inf Adj)
Guardians, Grandparents • Between 1991 and 1996, number of children living with one parent and either a step or adoptive parent increased by 16% • About 6% of all children live in household with one or more grandparents • 11% growth between 1990 and 1998 • 52% growth in children living with grandparents with neither parent present • Between 1990 and 1999, number of children in foster care increased by 35% • Between 1992 and 1999, number of children adopted from abroad increased 144%
Impact on Financial Aid Policy • Complications in assessing contribution • Deciding who should submit what forms • Consequences of non-compliance • Complications in managing communications • Deciding how to communicate parents’ expectation • Safeguarding privacy and confidentiality • Complications, complications, complications • Non custodial parent wants information • Non provider shows up at school • Stepparents feel no responsibility • Divorce decree says no tuition help • Support provided by non parental “others”