Download
1 / 37
370 likes | 417 Views
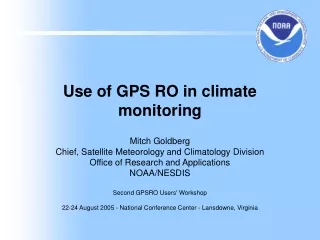
Use of GPS RO in climate monitoring. Mitch Goldberg Chief, Satellite Meteorology and Climatology Division Office of Research and Applications NOAA/NESDIS Second GPSRO Users' Workshop 22-24 August 2005 - National Conference Center - Lansdowne, Virginia. Topics. Challenges in Climate

E N D
Use of GPS RO in climate monitoring Mitch Goldberg Chief, Satellite Meteorology and Climatology Division Office of Research and Applications NOAA/NESDIS Second GPSRO Users' Workshop 22-24 August 2005 - National Conference Center - Lansdowne, Virginia
Topics • Challenges in Climate • Key Variables for Monitoring Climate Change • Satellites and Climate – difficulty of creating time series • Need for benchmark measurements • GPS RO as a benchmark • Need for other benchmarks – spectrally resolved radiances
Major Challenges in Climate • Reduce uncertainties in observed trends • Temperature, moisture, ozone, clouds, precipitation, aerosols • Improve physical modeling of climate feedbacks (water vapor – clouds – radiation) • Improve climate predictions
Climate Variables and their Importance • Forcing: external variables that control climate • Response: variables that respond to climate forcing • Feedback: variables that respond to climate forcing and modify the forcing
Climate Variables and their Importance (cont.) • Forcing: solar irradiance, CO2, CH4, O3, N2O, aerosols • Response: temperature, winds, precipitation, sea level • Feedback: water vapor, clouds, snow/ice cover, vegetation, ocean color, earth radiation budget Sea Level Rise (Cheney, 2004)
Satellites and Climate Satellites are ideal for monitoring climate since they provide: • constant, continuous, long-term observations needed for monitoring climate trends • global coverage required for observing global climate change • repeated observations of the globe with the same suite of instruments for measurement consistency
Where are We Now?Examples of Climate Data Records Based on Operational Satellite Observations Climate Product Satellite Instrument Producedby Since Earth Radiation Budget (ERB) Outgoing long-wave radiation (OLR) Absorbed solar radiation (ASR) POES/AVHRR NESDIS 1978 Ozone POES/SBUV/2 & POES/ATOVS/HIRS NESDIS/NASA 1985 Blended Sea Surface Temperature (SST) POES/AVHRR NESDIS/NWS 1981 DMSP SSM/I Climate Products (rainfall, rain frequency, snow cover, sea ice cover, clouds, water vapor, and oceanic wind speed) DMSP SSM/I NESDIS 1987 Vegetation (NDVI and drought index) POES/AVHRR NESDIS 1982 Atmospheric Temperature POES/MSU/AMSU 1979 U. Alabama ,RSS,NESDIS POES/AVHRR, GOES, Meteosat, GMS Visible imagery, DMSP/SSM/I Rutgers Univ. Climate Laboratory Snow Cover 1966 POES/AVHRR, GOES, Meteosat, and GMS Visible/IR imagery WCRP/International Satellite Cloud Climatology Project Clouds 1983 POES/AVHRR, GOES; Meteosat and GMS Visible IR imagery, DMSP SSM/I WCRP/Global Precipitation Climatology Project Precipitation 1986
Problems to be Overcome in Constructing Long-Term Data SetsNOAA’s current satellite instruments (except for SBUV ozone) were designed mainly for weather observations • Climate change signals are small (e.g., 0.2 C/decade) • Global averages have largevariability in space • No on-board vis calibration (current NOAA sensors) • Sensors degrade in space • Orbital drift • Afternoon orbits prior to NOAA-16 • Satellite to satellite discontinuities • No two instruments exactly alike With sat. intercalibration Without sat. intercalibration
Climate monitoring requires benchmark observations • To provide undisputable long-term trends • To vicariously calibrate other observing systems VIZ B to Vaisala (RS80) at Chuuck Island
Climate Benchmark Obs WHY ARE THEY NEEDED? • Provide record of absolute values of key observables valid for all time DEFINITION: • Focus on accuracy that provides absolute reference in perpetuity • Accuracy: The measure of how close the result of the experiment comes to the “true” values • Precision: The measure of how exactly the result is determined without reference to any “true” value • Measurement tied to irrefutable standards, with broad laboratory base • Experimental strategy designed to reveal systematic errors through independent cross checks, open inspection, and continuous interrogation • Limited number of carefully selected observables, with highly confined objectives, defining climate forcing, climate response (prediction) J. Anderson
Advantages of GPS Atmosphere Profiling • Absolute measurement • The technique needs no calibration. The basics of the observation are a measurement of time. • High accuracy (equivalent to < 1 deg K precision and < 0.1 K bias from 5-25 km) • No instrument drift or satellite-to-satellite bias • Global coverage • The geometry of the observation leads for one satellite to evenly distributed data on a 24-hour interval. Observations over seas and oceans (covering 70% of the Earth) minimize the major error sources in weather forecast and climate models. • High vertical resolution • The vertical resolution limited by the Fresnel zone of the observation leads to information of atmosphere phenomena with scale sizes less than 0.5 km. • Insensitive to clouds and precipitation • The wavelengths applied makes the measurement transparent to clouds and rain (hampering other space techniques).
Key contributor for Climate Monitoring • GPS RO temperatures will become the key benchmark measurement for temperature. • Significantly reduce uncertainties in long-term temperature change, especially in the upper troposphere and stratosphere. • GPS RO temperatures will be used to validate and vicariously calibrate temperature profiles from other observing systems (microwave, radiosondes) • Its an important component of the observation portfolio needed for climate.
AMSU measurements and products for climate monitoring – 1998 - present GPS RO temperatures can be used to intercalibrate AMSU sensors
IR Spectrum is a fundamental climate record The Infrared Radiance Spectrum Products: Water vapor (soundings, fluxes, winds) Temperature (sounding, stability) Carbon monoxide concentration (2 Layers) and total CO2 conc. Methane concentration (total column) Ozone concentration (4 Layers) Surface Temperature ,emissivity, land characterization Clouds (altitude, optical depth, microphysical properties, winds) Aerosol Concentration, Particle size and Depth
Advanced IR Sounders 2002-2020 • NASA AIRS - Atmospheric Infrared Sounder (2002) (14 km fov) • EUMETSAT IASI - Infrared Atmospheric Sounding Interferometer (2006) (12 km) • NPOESS CrIS - Cross-track Infrared Sounder (2008) (14 km) • GOES-R HES - Hyperspectral Environmental Suite (2012) (10 > 2 km)
Hyperspectral Dust/Aerosol Modeling Negative Slope – The Dust Signature Green – Clear Spectrum 920 650 1000 820 cm-1 Effect of Dust Layer Location Effect of Dust Particle Sizes Negative slope ( Sokolik, et al., 2002 - GRL) kCARTA+DISORT, spectral resolution = 0.0025 cm-1
Spectrally resolved radiances can be used to validate models
Benchmark measurements for Infrared and other spectral regions are more difficult to achieve • How to demonstrate in orbit? • More technically challenged. • Absolute calibration targets (moon) • Ground-based, aircraft calibration targets
Demonstration of AIRS accuracy and stability AIRSobs SHISobs (AIRSobs-AIRScalc) (SHISobs-SHIScalc) (AIRSobs-AIRScalc)- (SHISobs-SHIScalc) wavenumber
Summary • Benchmark observations are key for climate monitoring • GPS RO will significantly reduce uncertainties in temperature change, especially in the upper troposphere and stratosphere. • GPS RO temperatures will be used to validate and vicariously calibrate temperature profiles from other observing systems (microwave, radiosondes) • Other benchmarks are needed – Spectral Resolved Infrared Radiances. • Benchmark observations are direct observations, they are not retrievals because different assumptions will result in different trends • Benchmark observations are used to validate retrievals (derived geophysical parameter based on a first guess, radiative transfer, empirical tuning)
Coverage of COSMIC GPS RO sounding in one day Green dots are COSMIC soundings. Red dots are radiosonde stations.
stability low high high detecting change uncertainty Attribution understanding processes understanding change low Desired characteristics of an observing system (After G. Stephens, 2003)
PREFLIGHT SPECTRAL CAL SHOWS EXCELLENT SPECTRAL SHAPE AND STABILITY AIRS SRF Shape Well Characterized to <10-3 HIRS SRF Uncertainty is High Temperature Dependence Well Behaved
Why is Climate Important • Up to 40% of nation’s $10 trillion economy affected by weather and climate • Total U.S. economic impacts of the 1997-1998 El Nino were estimated to be on the order of $25 billion • US Gross Domestic Product may reduce by about 1% by 2100 due to projections of global warming
NOAA Strategic Plan: Climate • Build an end-to-end system of integrated global observations of key atmospheric, oceanic, and terrestrial variables • Enhance scientific understanding of past climate variations and present atmospheric, oceanic, and land–surface processes that influence climate • Apply this improved understanding to create more reliable climate predictions on all time scales • Predict probable consequences of global climate change on ecological systems and living resources • Establish service delivery methods that continuously assess and respond to user needs with the most recent, reliable information possible.
Scientific Data Stewardship (SDS) Program • NOAA Scientific Data Stewardship rooted in the National Academy of Sciences, National Research Council (NRC) dialogue and reports • NOAA/NRC SDS leads are: • John Bates • Mitch Goldberg
NRC Recommendation NOAA should embrace its new mandate to understand climate variability and change by asserting national leadership for satellite-based Climate Data Record generation, applying new approaches to generate and manage satellite Climate Data Records, developing new community relationships, and ensuring long-term consistency and continuity for a satellite Climate Data Record generation program.
METOP/NPP/NPOESSPayloads NPOESS Instruments LDN 0530 LDN 0930 LAN1330 METOP 0930 NPP 1030 IPO Developed Visible/IR Imager Radiometer Suite (VIIRS)* X X X X (AVHRR) X Cross-track IR Sounder (CrIS)* X X X (IASI/HIRS) X Conical MW Imager/Sounder (CMIS)* X X X Ozone Mapper/Profiler Suite (OMPS) X X (GOME) X GPS Occultation Sensor (GPSOS) X (GRAS) Space Environmental Sensor Suite (SESS) X X (SEM) Aerosol Polarimetry Sensor (APS) X Leveraged Advanced Technology MW Sounder (ATMS)* X X X (AMSU/MHS) X Operational Land Imager (OLI) X ARGOS-Data Collection System (ADCS) X X X Search and Rescue (SARSAT) X X X X Earth Radiation Budget Sensor (ERBS) X Total Solar Irradiance Sensor (TSIS) X Radar altimeter (ALT) X Advanced Scatterometer (ASCAT) X * Critical instrument - Failure constitutes need to replace satellite
Traits: Stability & Bias (After Stephens, 2003) Stability is a property of time variation of uncertainty (and hence accuracy and precision) Time, t2 Time, t1 unstable measurement uncertainty stable measurement time Unstable measurement, uncertainty grows as a function of time. This growth can occur through growth in accuracy error and growth in precision error.
Measured y accuracy, a precision, p Uncertainty, u = a2+p2 True y Traits: Accuracy, precision and Uncertainty (After Stephens, 2003)
y(t2) p(t2) a(t2) p(t1) a(t1) y(t1) True y Traits: Stability & bias (After Stephens, 2003)