Download
1 / 32
320 likes | 410 Views
This study aims to quantify and analyze driver impatience at busy crosswalks, considering factors like wait time, vehicle type, and driver characteristics. Operational definitions are established, and the Driver Impatience Score (DIS) is developed. Data is collected at different locations using observational methodology over three days, yielding 43 impatience scores. Statistical analyses include calculating DIS for each driver, examining correlations, and conducting multiple linear regression.

E N D
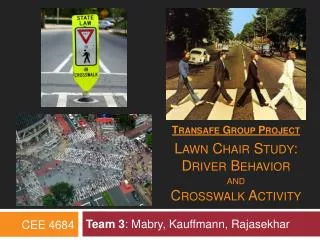
Transafe Group ProjectLawn Chair Study:Driver Behaviorand Crosswalk Activity Team 3: Mabry, Kauffmann, Rajasekhar CEE 4684
Introduction • Driver Impatience • Hard to define • Factors • Frequent traffic congestion: Vehicles, Pedestrians • Driver stress: • Personal – stress disorders, time crunch • Situational – mismatch between expected and existing road and traffic conditions • Individual driver differences: difficult to account for
Introduction • Different levels of impatience • Mild Impatience (our study) • Inching into crosswalk, tailgating, speeding, frequent and unsafe lane changes, severing around pedestrians etc • Severe driver aggression • Intentional following of a vehicle off the road, physical/psychological damage to property or person etc.
Introduction • Virginia Tech has around 30,000+ full time students • Frequently accessed academic buildings and activity centers surround the Drillfield • Subsequently, busiest crosswalks are those adjacent to the Drillfield • The peak usage of the crosswalks is during the 15-minute break between consecutive classes
Introduction • Not much studies related to driver impatience due to busy crosswalks • A study on driver behavior on Robert Morris University campus by Jade Hart, 2009 says: • students under stress may not take the time to fully stop at stop signs • Another study by DeVeauuse, et al., 1999; Hendrick, 2000 predicts: • faculty will comply with stop signs more frequently than students
Operational Definitions • Impatience is hard to quantify • Impatience Metrics • Inching into Crosswalk • Honking/Yelling • Revving engine • Deviating path/swerving around pedestrians • Vehicle contact with pedestrians • Different levels of impatience exist • Use a weighted scoring system to develop the Driver Impatience Score (DIS)
Operational Definitions • Situations where the drivers enter the crosswalk after the pedestrian(s) has almost crossed the crosswalk is not considered under driver impatience • Vehicles which were in queue but later on drive through the crosswalk with no wait time due to the absence of pedestrians are not included in the data collection
Study • An attempt to analyze and quantify various driver impatience matrices and to determine the DIS • Evaluation of the relationship between wait time and DIS • Determine the relation if any between various other factors like driver gender and age, vehicle type and number of occupants etc. and driver impatience
Hypothesis The wait time exhibited by a driver waiting at a crosswalk with pedestrians is a contributing factor to driver impatience. This wait time may be used in conjunction with driver and vehicle characteristics to predict the impatience exhibited by a subject vehicle.
Experimental Design • Choose a location for measurements • Each potential study area had flaws Source: Google Maps
Experimental Design • McBryde Crosswalk Source: Google Maps
Experimental Design • War Memorial Gym Crosswalk Source: Google Maps
Experimental Design • Final Site: Alumni Mall Intersection Source: Google Maps
Data Collection • Desired Data (Potential IVs) • Driver Characteristics: Age, Gender • Vehicle Characteristics: Type, # Occupants • Wait Time Data: In-queue and Front-of-queue • Impatience Metrics (DVs)
Data Collection • Methodology • Use “time stamps” versus recording actual wait time • All stations record color and make for data aggregation • Distribution of observation by location • Observer Stations • 1 – Back of Queue: Vehicle and driver information, time entering queue • 2 – Front of Queue: Crosswalk time stamps, assist in classifying impatience metrics • 3 – Crosswalk: Driver impatience metrics
Data Collection • Collection Periods • Observations made over three days • Same time period: Monday/Wednesday 1:00-2:25 • Captured two class changes: M/W 1:10-1:25 and 2:15-2:30 • Left early to get to class on time • Captured enough data to determine 43 impatience scores
Driver Impatience Score • To consider the severity of the impatience metric and the frequency with which it occurred, a Driver Impatience Score (DIS) was calculated for each driver • DIS = Total Sum [Weighted Score x Frequency] • Ex. Vehicle 001 (DIS) = Honking/Yelling (2x2)+ Dev Path (3x1)=7d
Statistical Analyses • Descriptive Stats • Mean, standard deviation, and range • Correlations • Examine the relationship between driver wait time at a crosswalk during high pedestrian traffic and measures of driver impatience (DIS) • Multiple linear regression • Examine the relationship between DIS and potential predictors including wait time, driver demographic information (age, gender), occupant and vehicle information
Statistical Analyses • Statistical Package for the Social Sciences (SPSS v.15) • Statistical significance was set at p=0.05
Conclusions • There is a positive association between driver impatience and wait time • R-statistic = 0.335 • In the regression, the only factor that proved predictive of driver impatience was wait time • Significant at p=0.04 • No other observed independent variables were significant • Graphically, no trend was observed due to excessive spread in the data • Only 16% of the variance in driver impatience was explained by the model which included wait time, driver demographic info, vehicle and occupant info
Next Steps • More data collection • More study locations • Various times of day • Additional independent variables • Analyze wait time components • Proposed pedestrian metering system
Any Questions? • References • Dulaa, Chris S. and E. Scott Gellerb, Risky, Aggressive, or Emotional Driving: Addressing the Need for Consistent Communication in Research, Journal of Safety Research(2003), pp 559-566 • Driver Aggression, AA Motoring Trust (April 1997) • Hart, Jade. Driver behavior on campus: A Robert Morris University Case Study, Annual Western Pennsylvania Undergraduate Psychology Conference (April 2009) • Hennessy, Dwight A. and David L. Wiesenthal, Gender, Driver Aggression and Driver Violence: An Applied Evaluation, Vol. 44 (June 2001) • Nasar, Jack L. Prompting Drivers to Stop for Crossing Pedestrians, Transportation Research Part F 6(2003), 175-182 • Sarkar, S. et. Al., Spatial and Temporal Analyses of the Variations in Aggressive Driving and Road Rage Behaviors Observed and Reported on San Diego Freeways, Transportation Research Record (2000)