Download
1 / 26
270 likes | 378 Views
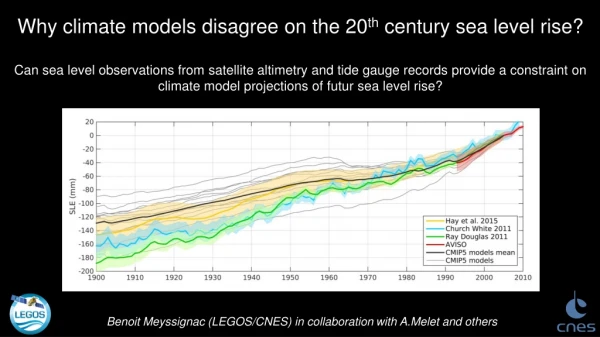
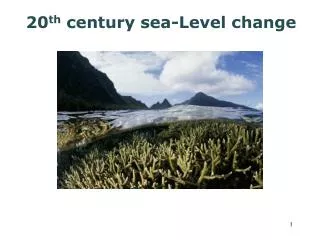
20 th century sea-Level change. The uncertain sea level future. The Earth ’ s ice is melting, sea level has increased ~3 inches since 1960 ~1 inch since 1993 signs of accelerating melting are now clear -land ice particularly striking, poles more complicated IPCC estimates project

E N D
The uncertain sea level future • The Earth’s ice is melting, • sea level has increased • ~3 inches since 1960 • ~1 inch since 1993 • signs of accelerating • melting are now clear • -land ice particularly • striking, poles more • complicated • IPCC estimates project • current trends forward • i.e. LOWER estimate • using no acceleration
Sea level rise: IPCC says 7” to 22” by 2100, much more if rapid ice sheet collapse occurs most scientists would go on record for 1m rise (30 inches)
During the last interglacial, temperatures were warmer than pre-industrial (by 5ºC), and sea level was higher by 5-6m Cuffey and Marshall, 2000 Greenland + West Antarctic = 14m
Sea Level Change based on tidal gauges Res. Curve = Obs. – Tides - Atmos. Press. Observations of Sea Level = Atmospheric Pressure + Tides
Measuring sea level changes in time: 1. Tide gauges Located at coastal stations, they measure the relative change in sea level. 2. Satellite altimetry Satellites in orbit around the planet use radar altimetry to measure the height of the sea level (accuracy of 2 cm). Attribution of observed changes: 1. Ocean heating and thermal expansion (steric effect) Requires detailed measurements of ocean heat content 2. Melting of land ice (eustatic effect) Difficult to measure directly: indirect measurements include area extent of glaciers and snow-covered regions, and changes in global ocean salinity
WOCE Sea Level Stations as of February 2000 (from Tidal Gauges) WOCE is the World Ocean Circulation Experiment http://woce.nodc.noaa.gov/wdiu/
What can we say about these tide gauges record? Arica Iquique Coquimbo 6/23/2001 6/24/2001
altimetry Satellites in orbit around the planet use radar altimetry to measure the height of the sea level (accuracy of 2 cm). http://www.ecco-group.org/animations_iter21/TP_ps21.mpeg
Spatial pattern of sea level change 1993-2003 (from Satellite) cm/yr
Geographical distribution of sea level trends (in mm/yr) computed from TOPEX/POSEIDON altimetry between January 1993 and December 1999. Yellow and red colors correspond to sea level rise, while blue color corresponds to sea level drop.
An example of Temperature measurements: Expendable Bathythermograph (XBT) Lines XBT
Closer look at Sea Level Change in the last 100 yr from Tidal Gauges and Dynamic Height (=thermal expansion of oceans) Tidal Gauges Ocean temperature & Salinity obs (green and red)
The Earth's climate has warmed about 1°C (1.8°F) during the last 100 years. (the warming follows the Little Ice Age (19th century) 1-2 mm/yr sea level rise) reduction in volume of ice caps, ice fields, and mountain glaciers thermal expansion of ocean water IMPACTS of HUMAN on SEA LEVEL: • Increase in greenhouse-gas emissions: • Global Warming expansion of oceans • many of the world's mountain glaciers will disappear • sea level rise acceleration FUTURE: Numerical models of the Climate System can be used to predict future changes in Sea Level?
Other processes contributing to Mean Sea Level on shorter Timescales and on local spatial scales. 100 m 10 m MSL Tsunami (Tidal waves) El NiÑo Ocean-Atmosphere interactions 1 m Vortices (Eddies) Wind generated waves Waves by ships Freshwater floods Decadal changes in Ocean Circulation Planetary Waves Ocean Current Tides Atmospheric Pressure 1 cm 1 day 30 days 1 year 10 yr 1 min 1 hour TIME
Spatial pattern of sea level change 1993-2003 (from Satellite) Steric sea trend changes 1955-1996 (from ocean temperatures)
ol. 294. no. 5543, pp. 840 - 842 DOI: 10.1126/science.1063556 Reports Sea Level Rise During Past 40 Years Determined from Satellite and in Situ Observations Cecile Cabanes, Anny Cazenave, Christian Le Provost The 3.2 ± 0.2 millimeter per year global mean sea level rise observed by the Topex/Poseidon satellite over 1993-98 is fully explained by thermal expansion of the oceans. For the period 1955-96, sea level rise derived from tide gauge data agrees well with thermal expansion computed at the same locations. However, we find that subsampling the thermosteric sea level at usual tide gauge positions leads to a thermosteric sea level rise twice as large as the "true" global mean. As a possible consequence, the 20th century sea level rise estimated from tide gauge records may have been overestimated.