Download
1 / 30
310 likes | 410 Views
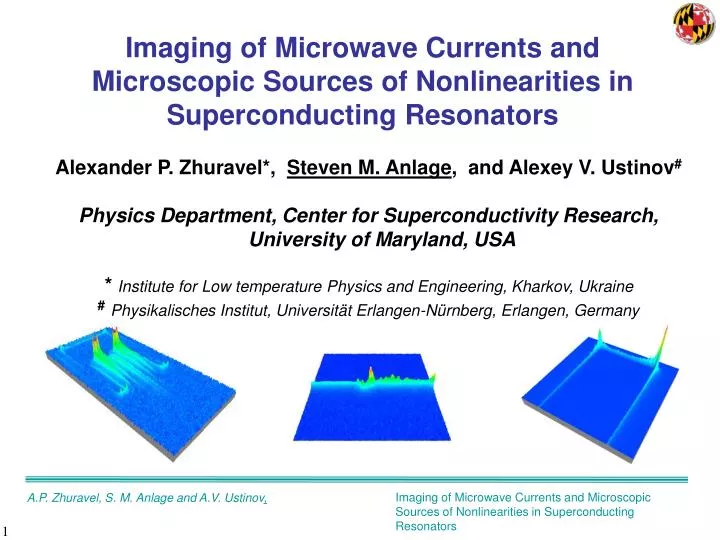
Imaging of Microwave Currents and Microscopic Sources of Nonlinearities in Superconducting Resonators. Alexander P. Zhuravel*, Steven M. Anlage , and Alexey V. Ustinov # Physics Department, Center for Superconductivity Research, University of Maryland, USA

E N D
Imaging of Microwave Currents and Microscopic Sources of Nonlinearities in Superconducting Resonators • Alexander P. Zhuravel*, Steven M. Anlage, and Alexey V. Ustinov# • Physics Department, Center for Superconductivity Research, University of Maryland, USA • *Institute for Low temperature Physics and Engineering, Kharkov, Ukraine • #Physikalisches Institut, Universität Erlangen-Nürnberg, Erlangen, Germany Imaging of Microwave Currents and Microscopic Sources of Nonlinearities in Superconducting Resonators A.P. Zhuravel, S. M. Anlage and A.V. Ustinov,
Motivation / Goals To image rf currents in operating superconducting microwave circuits and devices To identify sources of microwave nonlinearities in superconductors To investigate how rf currents are redistributed by mm- and nm-scale defects To develop new methods to investigate microwave nonlinearities in superconductors Imaging of Microwave Currents and Microscopic Sources of Nonlinearities in Superconducting Resonators A.P. Zhuravel, S. M. Anlage and A.V. Ustinov
Principle of the measurement modulated laser resonator transmission laser OFF Pout |S21(f0)|2 Pin laser ON |S21(f0)|2 f f0 co-planar resonator f0 ~ 5.2 GHz D|S12|2 ~ [JRF(x,y)]2 Local heating produces a change in transmission coefficient proportional to the local value of JRF2 J. C. Culbertson, et al. J.Appl.Phys. 84, 2768 (1998) A. P. Zhuravel, et al., Appl.Phys.Lett. 81, 4979 (2002) Imaging of Microwave Currents and Microscopic Sources of Nonlinearities in Superconducting Resonators A.P. Zhuravel, S. M. Anlage and A.V. Ustinov
Microwave imaging LSM LSM source PIN f0 laser beam T = 77 – 95 K YBCO film LAO substrate ground plane Microwave Resonator POUT amplifier switch crystal detector computer spectrum analyzer lock-in Imaging of Microwave Currents and Microscopic Sources of Nonlinearities in Superconducting Resonators A.P. Zhuravel, S. M. Anlage and A.V. Ustinov
Imaging modes of LSM • optical contrast • dc voltage contrast; • thermoelectric response imaging • linear microwave contrast • nonlinear (intermodulation distortion) microwave contrast Microwave Input Microwave Output Imaging of Microwave Currents and Microscopic Sources of Nonlinearities in Superconducting Resonators A.P. Zhuravel, S. M. Anlage and A.V. Ustinov
2-D Response Map for RF Current Distribution of a Sample Fundamental resonance mode (5.2 GHz) 8.5 mm 1 mm 10 mV RF photoresponse ~ Jrf2(x, y) LAO 0 mV T = 79.5 K f = 5.2133 GHz with 8672A Generator P = - 6 dBm in scale of 8672A 240 nm thick film
Standing Wave JRF Pattern at First Harmonic Frequency T=79.5 K with 8672 A Generator P=-6 dBm in scale of 8672A Fmod=99.99 kHz f=5.2133 GHz Photoresponse (a.u.) Fit: 2D image kfit = 0.39 mm-1 ktheory = 0.42 mm-1
Typical Spatial Profile of RF Photoresponse Along a Lateral Cross Section of the Resonator Strip YBCO/LaAlO3 CPW Resonator T = 79 K P = - 10 dBm f = 5.285 GHz fmod = 99.9 kHz 1 x 8 mm scan P1 = in-plane rotated grain P2 = crack in YBCO film P3 = LAO twin domain blocks Wstrip = 500 mm
Results: Crack LAO reflectivity YBCO JRFMAX Position of a crack y x JRF(x,y) 0 50 mm Evident spatial modulation of rf current density along the crack formed by localized vortices pinning on a twin-domain structure of the YBCO film Imaging of Microwave Currents and Microscopic Sources of Nonlinearities in Superconducting Resonators A.P. Zhuravel, S. M. Anlage and A.V. Ustinov
Results: In-plane rotated grain 200x100 mm reflectivity LSM image +10 dBm 0 dBm LAO -10 dBm YBCO Large Grain position Grain Boundaries 2D and 3D maps of RF current distribution in a YBCO film on LAO substrate A. Zhuravel, Appl. Phys. Lett. 81, 4979 (2002) Imaging of Microwave Currents and Microscopic Sources of Nonlinearities in Superconducting Resonators A.P. Zhuravel, S. M. Anlage and A.V. Ustinov
Influence of Substrate Twin Domain Topography on RF Current Distribution Reflectivity Image RF Photoresponse Sources of enhanced RF Photoresponse: Nanocracks induced by twinning Tapered edges Does this cause enhanced IMD? AFM topography Relative heights of LAO substrate
Device Under Test Meandering microstrip resonator (Agile Devices, USA) HTS strip: YBa2Cu3O7-d TC = 92 K, DTC = 6 K Thickness = 1 mm, Width W = 250 mm Substrate: LaAlO3(er =24.2) 5x10x0.5 mm3 Resonator at 77 K: loaded QL~2000, f0 = 1.85 GHz top view of the resonator topology YBCO film Patterned center line Capacitive coupling (g = 200 mm) Imaging of Microwave Currents and Microscopic Sources of Nonlinearities in Superconducting Resonators A.P. Zhuravel, S. M. Anlage and A.V. Ustinov
Results: Standing wave F F E G H A B D C PRmax 82.2 K Reflectivity LSM image G 0 B 5.9 GHz standing wave of YBCO/LAO 1850 MHz resonators. Sharp peaks due to corners C F Effect of hairpin geometry D E A H Only a very small fraction of the structure contributes to the global RF response. RF currents are peaked at the edges, however, interior corners give at least three times higher densities. Imaging of Microwave Currents and Microscopic Sources of Nonlinearities in Superconducting Resonators A.P. Zhuravel, S. M. Anlage and A.V. Ustinov
Modeling of the linear photo-response (PR) laser OFF f • Microwave transmittance |S21|2(f) of a resonator at РIN=0 dBm at a fixed temperature T = 80.7 K • difference between the traces in (a) that is proportional to the total PR, along with the inductive, insertion loss (IL) and resistive components d|S12|2 laser ON f0 insertion loss PRIL x 100 inductive PRX resistive PRR x100 total PR A. Zhuravel, et al., Appl. Phys. Lett. 88, 212503 (2006) Imaging of Microwave Currents and Microscopic Sources of Nonlinearities in Superconducting Resonators A.P. Zhuravel, S. M. Anlage and A.V. Ustinov
Partition of inductive and resistive components min max LSM PR PRR(x,y) reflective LSM image LAO resistive component YBCO PRR=|PR (f2)+PR (f1)| / 2 1 mm 300x300 mm2 B inductive component PR (f1) PR (f2) = ± = PRx=|PR (f2)-PR (f1)| / 2 A PR(f2) and PR(f1) are the LSM PR at equidistant frequencies f2 (above) and f1 (below) from f0 f1= 5.957 GHz f2= 5.977 GHz RF photoresponse maps obtained at T = 78 K, PRF(f1) = PRF(f2) = 0 dBm, and laser power PL = 123 mW. Areas A and B are chosen for detailed spatial analysis of the resonator RF properties. Imaging of Microwave Currents and Microscopic Sources of Nonlinearities in Superconducting Resonators A.P. Zhuravel, S. M. Anlage and A.V. Ustinov
Results: Power dependence of LSM PR 10 mm PR Inductive, PRX(x,y) peak 0 dBm +12 dBm -12 dBm 0 25 mm Resistive, PRR(x,y) -12 dBm 0 dBm +12 dBm Power-dependent penetration of PRX is spatially aligned with the direction of twin-domain blocks (TDB), whereas the development of the resistive state is uncorrelated with the TDBs. Note the different spatial scale for the upper and bottom figures. Imaging of Microwave Currents and Microscopic Sources of Nonlinearities in Superconducting Resonators A.P. Zhuravel, S. M. Anlage and A.V. Ustinov
Results: Power dependence of PRR(x,y) 10 mm PRR(x,y) YBCO LAO LAO LAO YBCO +2 dBm 0 dBm 3D plot of resistive LSM PR at +6 dBm +4 dBm +6 dBm Images of resistive LSM PR penetrating into HTS film (area B) at the different input HF power indicated in the images. White dotted boxes show the YBCO/LAO patterned edge. Brighter regions correspond to larger amplitude of PRR(x,y). Imaging of Microwave Currents and Microscopic Sources of Nonlinearities in Superconducting Resonators A.P. Zhuravel, S. M. Anlage and A.V. Ustinov
Global microwave response: Intermodulation Distortion Third-Order Intercept (TOI) Log-log plot of input power dependence of the fundamental RF signals (black diamonds) and two-tone the third order IMD (blue circles) measured at T = 83 K. POUT(f1) slope=1 POUT(2f1-f2) slope=3 >2 tones output: f1, f2 , 2f1-f2, 2f2-f1, … Pd=4 dBm RFOUT 1 mm RFIN 2 tones input: f1, f2 Imaging of Microwave Currents and Microscopic Sources of Nonlinearities in Superconducting Resonators A.P. Zhuravel, S. M. Anlage and A.V. Ustinov
Intermodulation distortion LSM imaging LSM induced changes in the amplitude of transmitted microwave signals POUT(f1) POUT(f2) 2f2 – f1 +IMD3 2f1 – f2 -IMD3 Df=1 MHz f0 100 kHz laser note 100 kHz square wave laser power modulation (red arrows). Imaging of Microwave Currents and Microscopic Sources of Nonlinearities in Superconducting Resonators A.P. Zhuravel, S. M. Anlage and A.V. Ustinov
- 42 - 43 - 49 - 55 2f1 -f2 2f2 –f1 x y Spatially-resolved microwave photo-response (a) (c) (b) RFOUT Y -14 -14 X 1x1 mm Power [dBm] - 42 - 43 1 mm f1 f2 Frequency RFIN 1x1 mm - YBCO film 1x1 mm - LAO substrate JRF Y X max JRF JIMD IMD PR Jrf Y Y max X X 0 0 (a) Top view of the resonator topology along with overall and (b, c) detailed 1x1 mm 3-d LTLSM plots (bottom images) showing (b) JRF(x,y) and (c) IMD PR distribution. The upper part of (b) shows the two input tones at –14 dBm as well as the output tones. The upper part of (c) shows the signals entering the spectrum analyzer after the primary tones have suffered partial cancellation. Imaging of Microwave Currents and Microscopic Sources of Nonlinearities in Superconducting Resonators A.P. Zhuravel, S. M. Anlage and A.V. Ustinov
Relevance to SRF Linear JRF(x, y) imaging of operating cavity or “coupon” sample Identify defects and weak links Enhanced JRF at Nb steps Image Reactive and Resistive contributions to photoresponse in an operating cavity Identify the nature of the defects Study correlation between Intermodulation production and high-Bsurface performance in Nb starting materials Image Intermodulation photoresponse in an operating cavity Does IMD predict high-surface-field performance?
SUMMARY The laser scanning microscope (LSM) is a convenient tool for imaging RF currents in superconducting microwave devices Many irregularities can be identified in the RF current flow: grain boundaries, cracks, defects, vortices, phase slips, current peaks at device edges and corners (IMD generation) Linear RF photo-response LSM images show JRF2(x,y) Our partition method allows to separate inductive and resistive changes in the microwave impedance Nonlinearities are mapped by intermodulation distortion (IMD) imaging: IMD features ~ JRF4(x,y) are thus sharper than linear response IMD response strongly varies at defects and device corners Imaging of Microwave Currents and Microscopic Sources of Nonlinearities in Superconducting Resonators A.P. Zhuravel, S. M. Anlage and A.V. Ustinov
Questions to be addressed RF / Superconducting properties Coupling with surface analysis! Is the comparison Samples/Cavities relevant? What is the link between DC/RF properties, between low field/high field properties? Are there other parameters “easy” to measure that could give us better prediction of the cavity behavior? Thermal transfer: influence of annealing, grain boundaries….
Thanks to my collaborators • Appl. Phys. Lett. 81, 4979 (2002). • IEEE Trans. Appl. Superc. 13, 340 (2003). • Low Temp. Phys. 32, 592 (2006). • Appl. Phys. Lett. 88, 212503 (2006). • cond-mat/0609244 (IEEE TAS 2007). We are now looking for new applications, collaborations and funding sources Steven Anlage Alexander Zhuravel
focused laser beam (lLAS = 670 nm, PL = 1 mW) heat source HTS film d x 21 21 21 21 21 21 substrate z 21 21 Laser-induced signal generation model The power distribution induced by a focused modulated laser beam can be described as: x-y z t spatial temporal The thermally induced changes of S21(f) in the probe are understood as LSM photo-response (PR) that can be expressed as: ~ where inductive PR + resistive PR + insertion loss PR Imaging of Microwave Currents and Microscopic Sources of Nonlinearities in Superconducting Resonators A.P. Zhuravel, S. M. Anlage and A.V. Ustinov
LSM PR min max PRX >> PRR PRX >> PRR PRX ~ PRR 25 mm F2 F1 FA Simplified estimate of resistive photo-response (a) (b) Inductive PR inductive Resistive PRx400 F1 F2 FA FB • resistive and inductive components of LSM photo-response (PR) • their ratio PRX << PRR resistitive FB Imaging of Microwave Currents and Microscopic Sources of Nonlinearities in Superconducting Resonators A.P. Zhuravel, S. M. Anlage and A.V. Ustinov
y x Conventional Laser Scanning Microscopy (LSM) laser beam laser power ac modulated patterned superconducting film dc current dc current 2 – 300 K V lock-in voltmeter dV(x,y) measured signal Imaging of Microwave Currents and Microscopic Sources of Nonlinearities in Superconducting Resonators A.P. Zhuravel, S. M. Anlage and A.V. Ustinov
Erlangen LSM setup Imaging of Microwave Currents and Microscopic Sources of Nonlinearities in Superconducting Resonators A.P. Zhuravel, S. M. Anlage and A.V. Ustinov
Y X Results: Corners and grain boundaries 100 mm 0.5 mm LAO IMD PR Reflectivity YBCO Vortices ILT Intermodulation LTLSM image showing a spatial modulation of the photoresponse at PIN = 4 dBm. Two different mechanisms of the LSM PR are shown. First one is the increasing of PR produced by grain boundaries (GBs) while in the second the LSM PR is reduced due to spatial vibration of RF induced vortices at the corner leading to an opposing electric field produced by the moving vortices. GBs Imaging of Microwave Currents and Microscopic Sources of Nonlinearities in Superconducting Resonators A.P. Zhuravel, S. M. Anlage and A.V. Ustinov
Microwave imaging LSM LSM f1 PIN sources isolators combiner laser beam f2 T = 77 – 95 K YBCO film LAO substrate ground plane Microwave Resonator POUT amplifier switch crystal detector computer spectrum analyzer lock-in Imaging of Microwave Currents and Microscopic Sources of Nonlinearities in Superconducting Resonators A.P. Zhuravel, S. M. Anlage and A.V. Ustinov