Environmental Data Analysis of Climate Change Effects in 40 Years
40 likes | 122 Views
Explore changes in temperature, rainfall, and fire occurrences over 40 years with detailed anomaly maps and comparisons using a 5 km grid. Data classified and allocated to BEC zones for analysis purposes.

Environmental Data Analysis of Climate Change Effects in 40 Years
E N D
Presentation Transcript
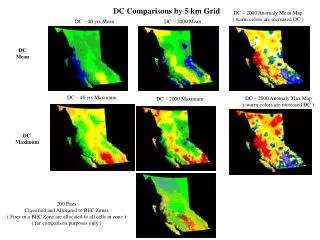
DC – 2000 Anomaly Mean Map ( warm colors are increased DC ) DC – 40 yrs Mean DC – 2000 Mean DC Comparisons by 5 km Grid DC Mean DC – 40 yrs Maximum DC – 2000 Maximum DC – 2000 Anomaly Max Map ( warm colors are increased DC ) DC Maximum 200 Fires Classified and Allocated to BEC Zones ( Fires in a BEC Zone are allocated to all cells in zone ) ( for comparison purposes only )
RAIN – 2000 Anomaly Mean Map ( warm colors are decreased rain ) RAIN – 40 yrs Mean RAIN – 2000 Mean RAIN Comparisons by 5 km Grid RAIN Mean RAIN – 40 yrs Total RAIN – 2000 Total RAIN – 2000 Anomaly Total Map ( warm colors are decreased rain ) RAIN Total 200 Fires Classified and Allocated to BEC Zones ( Fires in a BEC Zone are allocated to all cells in zone ) ( for comparison purposes only )
DSR – 2000 Anomaly Mean Map ( warm colors are increased DSR ) DSR – 40 yrs Mean DSR – 2000 Mean DSR Comparisons by 5 km Grid DSR Mean DC – 40 yrs Maximum DSR – 2000 Maximum DSR – 2000 Anomaly Max Map ( warm colors are increased DSR ) DSR Maximum 200 Fires Classified and Allocated to BEC Zones ( Fires in a BEC Zone are allocated to all cells in zone ) ( for comparison purposes only )
DSR Comparisons by 5 km Grid DSR – 40 yrs Mean DSR – 40 yrs Total 200 Fires Classified and Allocated to BEC Zones ( for comparison purposes only ) DSR – 2000 Anomaly Mean Map ( warm colors are increased DSR ) DSR – 2000 Anomaly Max Map ( warm colors are increased DSR )