IMPEDANCE SPECTROSCOPY
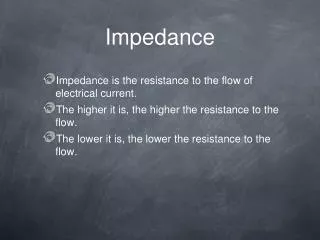
IMPEDANCE SPECTROSCOPY. By Dr. Mehran Javanbakht. F undamentals of Electrochemical Impedance Spectroscopy. I. Introduction : physics & electrotechnics Definition & properties of impedance Simple RC circuits and their spectra Measurement principles and graphical analyses.


IMPEDANCE SPECTROSCOPY
E N D
Presentation Transcript
IMPEDANCE SPECTROSCOPY By Dr. Mehran Javanbakht
I.Introduction: physics & electrotechnics • Definition & properties of impedance • Simple RC circuits and their spectra • Measurement principles and graphical analyses
How to characterize a two-pole (an electrical system)? Case A: a steady state current-voltage curve, I(U), existsat any moment.
How to characterize a two-pole (an electrical system)? Case B: the current-voltage curve, I(U) depends also on time, t The system can be characterizedthrough the time-dependence of the current: I(t) – U(t) relations are analyzed. Possibilities: transient response (following a jump or pulse)ac methods, „frequency” response (sinusoidal perturbation) Passive, linear electrical „two-poles”; I(k*U)=k*I(U)) are considered.
Operational definition of impedance: Stimulus: U(t)= Uac∙sin(ωt) Response: I(t) =Iac∙sin(ωt+ φ) Impedanceis defined as Z (Uac/Iacand φ) (Since I(k*U)=k*I(U)), the Uac/Iac is not dependent on Uac.)
Impedance (at one frequency): • is defined as Z (Uac/Iacand φ), complex number • ZUac/Iac· eiφ =Zabscos (φ) + i· Zabssin(φ) Euler’s formula with ZabsUac/Iac and i -1 • admittance: Y1/Z(Yabs=1/Zabs and φY= -φZ) • immittance = common term for impedance and admittance
Impedance (as function of frequency, (ω=2πf )): • it is called a spectrum (typically 10-3/s <w< 10+7/s); • representations • r∙eiφ r∙(cos(φ)+i∙sin(φ)) = Re + i∙Im; Nyquist: Im(Z) vs Re(Z) • ln(r∙eiφ) ln(r)+i∙φ • Bode: lg(Zabs) vs lg(f ) andφ vs lg(f )
Impedance of a network of RCL elements can be calculated just in the same way as the resistance of a network of resistors. • Impedance: • of serially connected elements: Zs = Z1+Z21/Ys= 1/Y1+1/Y2 • of parallely connected elements: Yp = Y1+Y21/Zp= 1/Z1+1/Z2 • Impedance: • of a resistor: ZRR • of a capacitor: ZC 1/(iwC) • of an inductor: ZL iwL
I.Introduction: physics & electrotechnics • Definition & properties of impedance • Simple RC circuits and their spectra • Measurement principles and graphical analyses
Cp||Rp Semicircle Characteristic frequency ω0=1/RpCp Time constant τ0=1/ω0
Circuits of different topologies may have the same impedance function. There is no unique connection of circuit and spectrum.
Rp||Cp sequences yield semicircle sequences; they are merged if the RC time constants are close to each other.
I.Introduction: physics & electrotechnics • Definition & properties of impedance • Simple RC circuits and their spectra • Measurement principles and graphical analyses
Simplest way: using sine-wave voltages FRA, lock-in amplifier ac voltage source: sine-wave generator Umeas: U(t)= Uac∙sin(ωt) Imeas: I(t) =Iac∙sin(ωt+ φ)
Typical measurement setups: for resistive systems for capacitive systems (dielectric spectroscopy)
Simple way of analysis: plotting and determining characteristic values Cp=1/(ω0*Rp) Rs Rs+Rp Use various representations.
Nyquist vs Bode representations: ln(r∙eiφ) ln(r)+i∙φ • Advantages (both are good): • Nyquist: „structures” are better seen • Bode: complete documentation of the data
Simplest way: using sine-wave voltages FRA, lock-in amplifier ac voltage source: sine-wave generator Umeas: U(t)= Uac∙sin(ωt) Imeas: I(t) =Iac∙sin(ωt+ φ)
Mechanistic studies and identification of processes • Goal: Identification of the appropriate model • (equivalent circuit AND the underlying physico-chemical processes) • Measure Z(ω) as function of E, ci, T, etc • Repeat • Construct model with reasonable assumptions; calculate its impedance function (perhaps expressed as an equivalent circuit, also as function of E, ci, T, etc) • Estimate the model’s parameters (e.g. by NLLS fitting) • Until • a. the measured and calculated Z(ω) spectra are similar to each other; • b. the E, ci, T, etc dependencies are correct (not self-contradictory).
Determination of values of parameters (when the model is already established) Cp: Interfacial capacitance Structure of the interface (double layer, adsorption) Bulk - interface Rs: Bulk conductivities General characterization Dielectric spectroscopy Rp: Charge transfer resistance Electrochemical kinetics Corrosion
Measurement modes: Multiple frequency mode: impedance spectrum measurement (at constant Edc) – followed by the determination of the parameters • Single frequency mode: with scanned Edc; examples: • ac voltammetry (for characterization of charge transfer); • capacitance measurements with (high) f and with (slowly) scanned Edcrequires the a priori knowledge of the equivalent circuit;
Bulk resistance • Resistance is determined through impedance spectrum measurements if: • a single resistance cannot be measured (only a network’s impedance); • typically high resistance materials which are difficult to be contacted; • jointly with the determination of permittivity; • polymer membranes, ionic conductors, porous structures.
Time evolution of the impedance spectra of a physically dryingstyrene-acrylateself-standing resin film in 0.1M KNO3 solution (100 kHz - 1 Hz), Lendvay-Győrik et al, 2007.
Interfacial capacitance 1. Calculation of adsorbate coverages: thus • 2. Determination of „zero points” (of space charge layers): • Metal / solution of a binary electrolyte of low concentrationHg (Au, Ag) in 1-100 mM NaF solution (two mobile charge carriers) • II: Metal / extrinsic semiconductor junction n – or p doped semiconductor metallized or a semiconductor electrode in aqueous solution (one fixed and one mobile charge carrier)
Interfacial capacitance Determination of „zero points” (of space charge layers): Model: The distribution of the mobile charges (ions or electrons or holes) is determined by the electrostatic potential and the thermal motion: Poisson - Boltzmann equation Expressed quantity: space charge layer capacitance vs potential.
Determination of „zero points”, A: Metal / solution of a binary electrolyte of low concentration (two mobile charge carriers): Capacitance has a minimum at the pzc (potential of zero charge - at which the ion accumulation nearby the metal, in the solution vanishes). „Gouy-Chapman minimum”, Hg in NaF solution, Grahame (1947)
Determination of „zero points”, B: Metal (or electrolyte) / extrinsic semiconductor junction (one fixed and one mobile charge carrier) Mott-Schottky plot (ZnO, Freund & Morrison, 1989) 1/C2 vs E: determination of n0 and Efb (flatband potential – at which the space charge layer in the semiconductor vanishes)
Parallel resistance • Parallel resistance – interpreted as a charge transfer resistance • exchange current density is calculated ( = kinetics information) • typical use: average corrosion rate is calculated • for details, see many application notes
Determination of Rp - corrosion tests Fe in H2SO4 (5..100mM) at corrosion potential (Lendvay-Győrik et al, 2000) TiCxNy film (on steel) in Na2SO4 (0.5M) at function of time (Senna et al, 2000)
Determination of Rp - corrosion tests, inhibitor studies Fe in 1M HCl with and without 1 mM oct-1-yn-3-ol (octynol, inhibitor), at corrosion potential (Lendvay-Győrik et al, 2003) c b a a: without 1-octynol b: with 1 mM 1-octynol c: with 1 mM 1-octynol, after an anodic treatment
Coating tests: • An ideal polymer, insulating coating is capacitive. • Corrosion + transport through the pores – causes a shunt term - C||R. EIS response of a pipeline coating in 5% NaCl at 65°C, L. Grayet al (2003) in: D. Loveday et al, JCT CoatingsTech, 2005
Technical issues: 1.EIS can be used for characterizing stable systems only.A good practice for testing stability is to repeat the measurements (e.g. with decreasing then increasing frequencies). Kramers-Kronig test may help. 2. Decrease noise. Use Faraday-cage. Use the preamplifier supplied with the potentiostat. Connect an oscilloscope to the E output of the potentiostat to monitor noise level. 3. Troubleshooting:Check the system by measuring the impedance spectra of resistors and dummy cells of similar characteristics to the systems studied.
4. Cells for high frequency (>1..10 kHz) impedance measurements: a. Low impedance reference electrode should be usedb. Avoid cells of low „feedback ratio” c. Ensure uniform current density distribution
a. Low impedance reference electrode: Avoid high resistance solution paths between cell and reference electrode. To shunt the high resistance paths, use a capacitively coupled auxiliary reference electrode (C≈1-10μF)
b. Low feedback ratio: Do not place the counter electrode „far away” from the W and R
c. Uniform current density distribution From www.mpmtechnologies.com, MPM Technologies, Inc., State College, PA, USA
5. Calibration:with dummy cells having Z(ω) similar to the system studied + with two resistors (approx. Rsol,1andRsol,2) for the hf accuracy.
Fitting of impedance spectrum: a demo; measurement: Ir(100) in 0.1M HCl, 0.1V vs SCE, model: □,◊ measured, x,+ calculated absolute values and phase angles
• Always plot the measured and fitted curves together in various representations (Bode is the best for this) • Calculate & plot the difference of the measured and fitted points – try to get rid of the systematic deviations • Inspect errors of parameters
How to present data? • 1. Raw data: measured impedance spectra • Nyquist (r∙eiφ r∙(cos(φ)+i∙sin(φ)) = Re + i∙Im): Im(Z) vs Re(Z), „structures” are better seen • Scale of Im(Z) and Re(Z) must be identical • Bode (ln(r∙eiφ) ln(r)+i∙φ): • lg(|Z|) vs lg(f ) and φ vs lg(f ), for documentation of the data • Other representations like log(Im(Z)) vs log(Re(Z)): avoid • 2. Processed impedance data (with or without fitting) a. Normalize to unit area (Ohm•cm2)b. Subtract series (solution) resistance → interfacial Zic. Zi → interfacial admittance, Yi(ω) → interfacial capacitance, Ci(ω)Ci(ω) Yi(ω) /i ω=1/ [i ω(Z(ω)-Z(ω))]is also a complex function → Bode, Nyquistd. Plot together fitted and measured spectra