Understanding the Distinction Between Weather and Climate: A Comprehensive Overview
120 likes | 461 Views
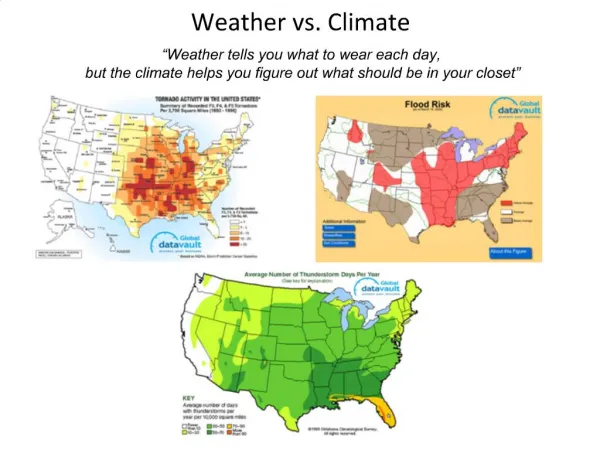
This article explores the fundamental differences between weather and climate. Weather refers to short-term atmospheric conditions that dictate our daily lives, such as clothing choices and immediate forecasts, while climate encompasses the long-term patterns that influence agriculture and seasonal expectations. We examine the specifics of Franklin County's weather, including storm patterns and precipitation trends, and highlight data on temperature and rainfall in New England. The pieces come together to illustrate how weather events like thunderstorms and hurricanes affect us now versus the broader, persistent climate changes over decades.

Understanding the Distinction Between Weather and Climate: A Comprehensive Overview
E N D
Presentation Transcript
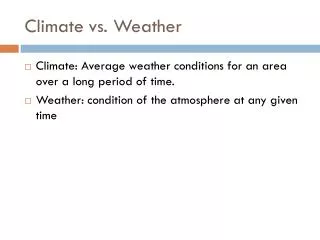
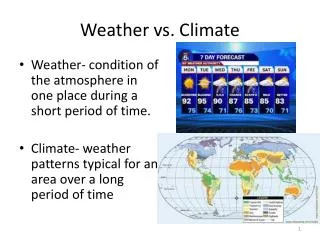
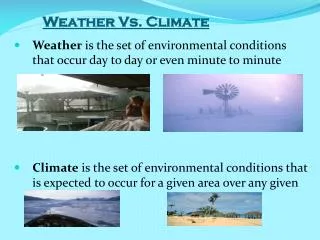
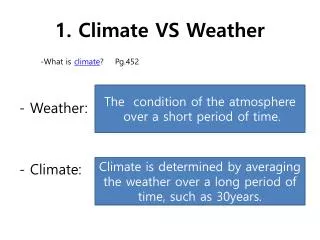
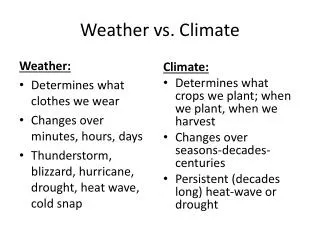
Weather vs. Climate Weather: • Determines what clothes we wear • Changes over minutes, hours, days • Thunderstorm, blizzard, hurricane, drought, heat wave, cold snap • Climate: • Determines what crops we plant; when we plant, when we harvest • Changes over seasons-decades-centuries • Persistent (decades long) heat-wave or drought
Franklin County weather: www.wunderground.com
2010 Data www.wunderground.com
New England Climate “humid continental” • Large seasonal distinctions • hot summers and cold winters January: Cold Precipitation comes from large storms Nor’easters—form in Gulf of Mexico and move up the northeast coast—lots of snow inland/rain on coast/wintry mix July: Warm Precipitation comes from thunderstorms T-storms form because the air is warm and humid; storms move from west to east. Slightly less precipitation in summer than in winter.
Boston, MA Albany, NY Average temperature and precipitation based on data from 1938 to 2001 http://drought.unl.edu/whatis/climographsdomesticenglish.htm
Red line: annual global-mean temperature record Blue lines: 8-year trend lines (1 for each 8-year period of data in the graph) http://www.realclimate.org/index.php/archives/2008/01/uncertainty-noise-and-the-art-of-model-data-comparison/
Red line: annual global-mean temperature record Blue lines: 15-year trend lines (1 for each 15-year period of data in the graph) http://www.realclimate.org/index.php/archives/2008/01/uncertainty-noise-and-the-art-of-model-data-comparison/
8 years of Global Temperature Anomalies plotted for three different time series http://data.giss.nasa.gov/gistemp/tabledata/GLB.Ts.txt
Web resources • The difference between weather and climate: • http://www.ncdc.noaa.gov/paleo/ctl/digging_weather.html • http://weathereye.kgan.com/cadet/climate/climate_vs.html • http://www.gcrio.org/gwcc/booklet1.html • Scroll down to History and Almanac for climate/weather averages http://www.wunderground.com • The NEW National Climate Service http://www.climate.gov • Retrieve plots of average weather conditions since 1895 http://www7.ncdc.noaa.gov/CDO/CDODivisionalSelect.jsp • Lots of data in tabular format http://www.wxresearch.com/usnorm.htm • Global Temperature Data http://data.giss.nasa.gov/gistemp/