Download
1 / 15
150 likes | 165 Views
This study simulates the processing of rough aerial images in resist, PEB acid diffusion, and subsequent etching, and explores the influence of secondary electron statistics. The simulations show the impact on spectral power and LER, as well as the effects of experimental artifacts.

E N D
More Moore SP3WP6.4 Simulation of processingInfluence of secondary electron statistics
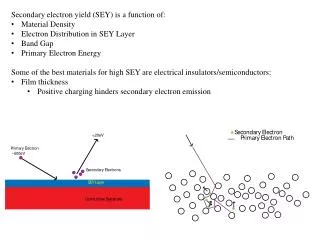
Simulations of processing • Rough aerial image in resist represented with white noise • PEB acid diffusion represented by ‘blurring’ edge outward • Subsequent etch represented by ‘blurring’ edge inward DPS 2004, Leunissen et al.
Simulations of processing • High frequency components mitigated by acid diffusion Animation of acid diffusion 0 to 10 nm
Simulations of processing • Decrease of high frequency components reduces total spectral power Animation of acid diffusion 0 to 30 nm
Power Spectrum y ~ x-1.46 litho(30nm) white noise edge 1 10 100 1000 Simulations of processing • Simulation matches shape familiar from typical experimental results
Simulations of processing • Not so much influence on spectral power since high frequency components are already ‘blurred away’ Animation of etch 0 to 30 nm
Simulations of processing • LER decreases during etch, but it depends on amount of LER that is already ‘blurred away’ during acid diffusion
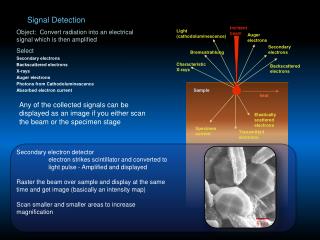
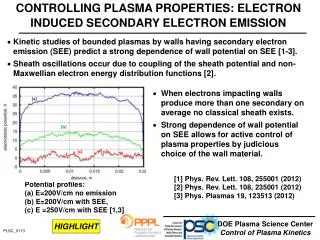
hn < 20 eV hn > 20 eV Statistics of secondary electrons • DUV lithography: pure photochemistry • EUV lithography: secondary electron generation • Secondary electron blur • Super-Poissonian noise
"single photon noise" MC simulation Poisson distribution mAE=3.2 0 5 10 15 # chemical excitation events Statistics of secondary electrons • Model predicting SE blur from excitations, ionizations, plasmon loss and elastic scattering (MNE 2004) • Mean number of chemical activation events: mAE 3 • (S. Tagawa: 1~3 e.g. MNE 2004)
Statistics of secondary electrons • Resist sensitivity according to the ITRS Litho RoadmapEUV: 2 – 15 mJ/cm2 1.4 – 10 g/nm2 • Shot noise induced dose variation can be reduced using higher dose • Statistics in chemical activation events leads to “effective dose variations”:For mAE=2, effective dose variations have to be compensated with 50% higher dose
Determination of dose induced LER • Need high contrast and good dose control: preferably MET vary dose / line width
Experimental artifacts • Environmental vibrations • Source uniformity (temporal) • Source uniformity (spatial) • Optics / mask errors • CD measurement • Resist contrast repeat exposures with different illumination time; source characteristics repeat with different masks repeat CD measurements repeat exposures with different resist contrast
Procedure to correct for artifacts • Line edge Yi,j = Ai + Bj + Ei,j • i is index of photo • j is index of line within a photo • A is measure for variation due to SEM imaging • B is measure for variation due to mask error, source uniformity • E is measurement error and shot noise • E = dose dependent noise + residual noise • This elaborate procedure proves necessary at the desired extreme sensitivities, to discriminate true shot noise from experimental artifacts
redundancy mask errors multiple illumination CD wafer / PEB variations Experimental setup • Multiple CDs on mask • Multiple gratings • Multiple wafer positions • Multiple illuminations • Multiple photon energies (for SE blur measurement) • Multiple CD SEM imaging
Summary • Transfer of LER during etch better understood • Additional effective “dose variation” due to statistics in chemical activation possible point of concern • Determination of dose induced high frequency LER could be seriously hampered by experimental artifacts