Electron probe microanalysis
Electron probe microanalysis. Accuracy and Precision in EPMA: The Role of Standards. Revised 03/26/12. What ’ s the point?.

Electron probe microanalysis
E N D
Presentation Transcript
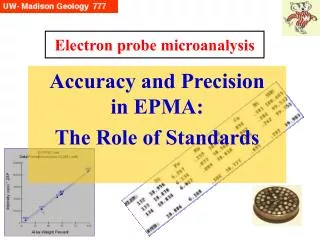
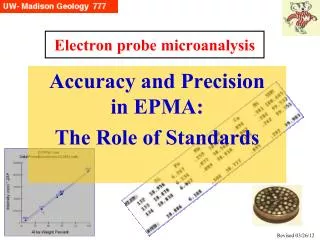
Electron probe microanalysis Accuracy and Precision in EPMA: The Role of Standards Revised 03/26/12
What’s the point? EPMA’s claim to fame as a microanalytical tool rests upon (1) faith in a correct matrix correction and (2) use of “good”, “correct”, “true” standards. How do you know to trust a standard?
Standards • In practice, we hope we can start out using the “best” standard we have.* There have been 2 schools of thought as to what is the “best” standard is: • a pure element, or oxide, or simple compound, that is pure and whose composition is well defined. Examples would be Si or MgO or ThF4. The emphasis is upon accuracy of the reference composition. • a material that is very close in composition to the unknown specimen being analyzed, e.g. silicate mineral or glass; it should be homogeneous and characterized chemically, by some suitable chemical technique (could be by EPMA using other trusted standards). The emphasis here is upon having a matrix that is similar to the unknown, so that (1) any potential problem with the matrix correction will be minimized, and (2) any specimen specific issues (i.e. element diffusion, volatilization, sub-surface charging) will be similar in both standard and unknown, and largely cancel out. * This is based upon experience, be it from prior probe usage, from a more experienced user, from a book or article, or trial and error (experience comes from making mistakes!) It is commonly a multiple iteration, hopefully not more than 2-3 efforts.
Standards - Optimally • Ideally the standard would be stable under the beam and not be able to be altered (e.g., oxidizable or hygroscopic) by exposure to the atmosphere. • It should be large enough to be easily mounted, and able to be easily polished. • If it is to be distributed widely, there must be a sufficient quantity and it must be homogeneous to some acceptable level. • However, in the real world, these conditions don’t always hold. “Round Robins” On occasion, probe labs will cooperate in “round robin” exchanges of probe standards, where one physical block of materials will be examined by several labs independently, using their own standards (usually there will be some common set of operating conditions specified). The goal is to see if there is agreement as to the compositions of the materials.
Sources for standards : • Purchased as ready-to-go mounts from microscopy supply houses as well as some probe labs ($1200-2000) • Alternately, most probe labs develop their own suite of standards based upon their needs, acquiring standards from: • Minerals and glasses from Smithsonian—wet chemically analyzed (Dept of Mineral Sciences: Tim Rose, free) • Alloys and glasses from NIST -- certified to some level for some elements (~$100-200 ea) • Metals and compounds from chemical supply houses – not certified, caveat emptor (~$20-150 ea) • Specialized materials from researchers (synthesized for experiments, or starting material for experiments) – both at home institution as well as globally (some $, most free) • Swap with other probe labs • Materials from your Department’s collections, local researchers/ experimentalists, local rock/mineral shop (e.g., Burnie’s) or national suppliers (e.g., Wards). Always must be carefully checked/examined.
USNM Standards • 1980: Gene Jarosewich, Joe Nelen and Julie Norberg at the Smithsonian Dept of Mineral Science (US National Museum) published results of an effort to develop epma standards for minerals and glasses. They had crushed, separated, then examined for homogeneity; once a subset found, it was analyzed by classical methods (wet chemistry), and then made available for distribution. This list included 26 minerals and 5 glasses. In 1983, Jarosewich and MacIntrye published data on 3 carbonate standards (calcite, dolomite and siderite), and in 1987, Jarosewich and White published data on a strontianite (SrSO4) standard. These all are available at no cost to probe labs. • These are excellent standards. Users must be aware of course that the “official value” represents a bulk analysis and individual splits may be different. One problem is the small size of many grains (~100-500 mm). • Another problem recently discussed (Albuquerque M&M 2008) is the presence of small inclusions in a not insignificant fraction of the grains. This requires the prober be very careful.
Other Mineral Standards • In the 1960s, Bernard Evans developed a suite of silicate and oxide mineral standards (at UC Berkeley) that were available for EPMA work. Some of these are still around (Gordon Medaris uses these). • 1992, McGuire, Francis and Dyar published report on evaluation of 13 silicate and oxide minerals as oxygen standards. They included data for all elements. Available from Harvard Mineralogical Museum for small cost (~$100-150). • Here in Madison, I have evaluated several minerals from the Mineralogy collection for standards and found some very good: casserite (SnO2), wollastonite (CaSiO3), Mg-rich olivine and enstatite. Other minerals from Wards have been found to be useful (biotite and F-topaz). On the other hand, other efforts have been unsuccessful (e.g., ilmenite from Wards -- zoned/exsolution lamellae) • Our SIMS lab is developing standards for their work, and some of these materials (minerals, glasses) turn out to be good EPMA standards also
Synthesized Standards • 1971, Art Chodos and Arden Albee of Caltech contracted Corning Glass to produce 3 Ca-Mg-Al borosilicate glasses (95IRV, W and X) containing a number of (normally) trace elements, at 0.8 wt% level, to be used as EPMA trace element standards. They are available now from the Smithsonian. • 1971, Gerry Czamanske (USGS) synthesized 73 sulfides and 3 selenides/tellurides (for phase equilibria studies). Some of these were made available to EPMA labs. We have them here. • 1972, Drake and Weill (U. Oregon) synthesized 4 Ca-Al silicate glasses each with 3-4 REE elements. • 1991: Jarosewich and Boatner published data on a set of 14 rare-earth (plus Sc and Y) orthophosphates (synthesized by Boatner). These are also available at no charge from the Smithsonian. (A recent study by Donovan et al. showed that many have some unreported Pb impurities, a problem for monazite age dating.) • John Hanchar (Memorial University, NFLD) has been working on synthesizing zircon, hafnon, thorite and huttonite; some are now available for standards. • There are other synthetic standards available, usually in limited quantities; one discovers these sources by “asking around”. • Have skilled users (who have experimental equipment) make up some compounds of elements for difficult analyses (e.g. Al, Mg, Ti, Mn where pure metal standards oxidize)
Evaluation of synthetic glasses Recently Paul Carpenter et al did a rigorous evaluation of the 95IRV, W and X glasses. Shown here are the results for one of the glasses, 95IRW. This is a very valuable study, and is unusual in its thoroughness, as demonstrated in the X-ray maps, a few of which are shown here. The glasses have the trace oxides at ~.8 wt %, and with good homogeneity (200-300 ppm range) for all but Cs, which has a much wider (1000 ppm) range. From Carpenter et al NIST-MAS presentation, 2002.
NIST Standards The National Institute of Standards and Technology (previously National Bureau of Standards) began to develop EPMA standards over 30 years ago. SRM = Standard Reference Material
NIST Standard SRM 482: Example... and problem To the right are the documentation as well as examples of the materials supplied when one purchases a NIST standard: here, a set of 6 wires in the Cu-Au binary. At the recent (April 2002) NIST-MAS workshop on accuracy in EPMA and the role of standards, Eric Windsor of NIST presented the results of a study into these Cu-Au standards. For some time, there had been some reports of small levels of impurities in these standards. It turns out that there are micron-size Cu-oxides present, and the abundance is a function of the type of surface preparation/polish. From Eric Windsor, NIST-MAS presentation, 2002
Supply House Standards • Some pure elements and compounds purchased from chemical suppliers may be good epma standards. However, it pays to pay close attention and be careful and test them carefully. It is apparent that many materials are processed and sometimes have two phases present, whereas they are ‘certified’ as one phase. They get away with this ‘error’ because the one of the phases is an oxide of the first, and the compositions are stated to be pure to some level (e.g. 99+% on a metal basis). This in fact can be a benefit, and provide 2 standards-in-one, provided the second phase is easily distinguished. • Cr2O3 (99.7%) turned out to have small Cr blebs • CuO (99.98%) grains turned out to have cores of Cu2O • Cr fragments and Re and Ir rods seem to be pure • MgAl2O4, FeTiO3 & MnTiO3 (99.9%) were not homogeneous at all!
How do you evaluate your Standards? The traditional answer is that decide your standards are “good” by testing if they give you the answers you think you should be getting, i.e. you run other standards as secondary standards and see if you get the correct composition for them (optimally they haven’t been used in calibration). This is done one-by-one, comparing one pair of primary and secondary standards. However, we now have a powerful rapid technique that compares the functioning of several standards against each other at the same time, e.g. you acquired Si counts on your forsterite, fayalite, plagioclase, pyroxene, garnet, and sillimanite standards. You can then plot up the “official” compositions against the count rates that have been adjusted for the matrix effects in each standard. If they all plot up on a straight line*, then they all are good. If one is ok, there is a good chance there is something amiss about it (could be slightly different composition from the “official” value). I suggested to Donovan that this would be a useful addition to the Probe for Windows software 2 summers ago, and he soon developed the “Evaluate” program. * The line is pinned at the high end by the standard with the highest concentration of the element in question (which could be pure element or oxide), and should go through the (0,0) origin at the low end.
Best fit Max count forced thru (0,0) “Evaluate” Standards Here 2 standards (Al-Fe-Si alloys) synthesized by Fanyou Xie (MSAE) are plotted with Si defined by #1100, Al2Si4F2. Note that #614 is above the line, suggesting its real composition may be higher (shift to right). Al can be a problem (oxide layer). Here I was testing std #9979, Al-Mg alloy (98 wt% Al) and #9978, Al-Si alloy (99 wt% Al) against other standards including #13 (Al2O3) and Mg-Al alloy (#8903). Fanyou’s standards are better for unknowns with ~60 wt% Al.
“Evaluating” Silicate Standards SiO2 CaSiO3 NaAlSi3O8 Al2Si4F2
Virtual Standards Occasions arise when there is no standard available, for one reason or another. Above is a case where a low total in a specimen led to a search for the missing elements, and after some leg work, it was learned that the specimen had been produced by sputtering in Ar. A wavescan showed an Ar Ka peak. However, I had no Ar standard. This led to discussions with John Donovan, and he subsequently developed the “Virtual Standard “ routine now in PfW.
EPMA Standards • Bottom Line • Must be homogeneous at the sub-micron level (so that any “interaction volume” will have the same x-ray intensities for characteristic lines as any other in the sample. Note that this allows for nanometer-scale differences. • Must have an accurate (=true) known chemical composition