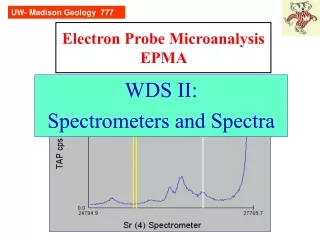
Electron probe microanalysis
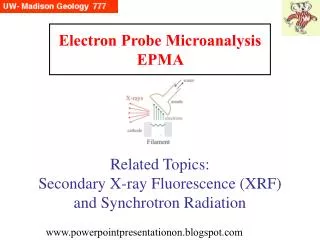
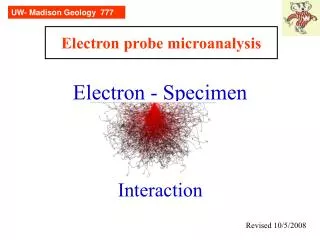
UW- Madison Geology 777. Electron probe microanalysis. Electron - Specimen. Interaction. Revised 10/5/2008. UW- Madison Geology 777. What’s the point?. Electrons from a source interact with electrons in specimen yielding a variety of photons and electrons

Electron probe microanalysis
E N D
Presentation Transcript
UW- Madison Geology 777 Electron probe microanalysis Electron - Specimen Interaction Revised 10/5/2008
UW- Madison Geology 777 What’s the point? Electrons from a source interact with electrons in specimen yielding a variety of photons and electrons via elastic and inelastic scattering processes. These are the “signals” that we monitor and measure to characterize our specimens.
UW- Madison Geology 777 Overview Elastic and inelastic processes Characteristic and continuum X-rays K,L,M etc: families of X-rays Energy versus wavelength Moseley’s relation Absorption or critical excitation energy Interaction volume and ranges Monte Carlo models Odds of X-ray production
UW- Madison Geology 777 Elastic and inelastic scattering of HV electron by sample Elastic (a): incident electron’s direction altered by Coulombic field of nucleus (Rutherford scattering), screened by orbital electrons. Direction may be changed by 0-180° (ave 2-5°) but velocity remains virtually constant. <1 eV of beam energy transferred. Inelastic (b): incident electron transfers some energy (up to all, E0) to tightly bound inner-shell electrons and loosely bound outer-shell electrons. Direction barely changes (<0.1°) E0 = accelerating voltage (of electrons emitted from gun); usually 15-20 keV (Goldstein et al, 1992, p.72)
UW- Madison Geology 777 Elastic and inelastic scattering of HV electron by sample This represents 1000 electron trajectories (idealized), in a cross-section--both elastic and inelastic scattering. (Goldstein et al, 1992, p.72)
UW- Madison Geology 777 Scattering lexicon Cross section: a measure of the probability that an event of a certain kind will occur, e.g. K-shell cross section. Defined as Q = N/nint, where N=events of certain type/vol (sites/cm3), ni=number incident particles/unit area (particles/cm2), and nt=number target sites/vol (sites/cm3). Q has units of cm2 and is thought of as an effective ‘size’ which the atom presents as a target to incident particle. The Q for elastic scattering is ~10-17 cm2 and for K-shell ionization is ~10-20 cm2. Mean free path: average distance an electron travels within a specimen between events of a specific type. MFP=A/(NArQ) where A is atomic wt (g/mol), NA is Avogadro’s number, r is density (g/cm3).
UW- Madison Geology 777 Elastic : Backscattering of electrons (~high energy) Inelastic : Plasmon excitation (in metals, loosely bound outer-shell electrons are excited) Phonon excitation (lattice oscillations: heating) Secondary electron excitation Inner-shell ionization (Auger electrons, X-rays) Bremsstrahlung (continuum) X-ray generation Cathodoluminescence radiation (non-metal valence shell phenomenon) Elastic and inelastic scattering
UW- Madison Geology 777 Backscattered Electrons High energy beam electrons may suffer single or multiple elastic scattering events in the solid, escaping from the material. The fraction of beam electrons that scatter back (h) was found experimentally to vary directly as a function of composition (atomic number Z). This provides a valuable imaging tool: a rapid means to discriminate phases that have different mean Z values. Intensity (grey level) varies from black (voids/epoxy), to plagioclase, olivine, basaltic glass, with Ti-magnetite the brightest phase.
UW- Madison Geology 777 Inelastic scattering of HV beam electron can promote loosely bound electrons from valence to conduction band in semiconductor or insulator with enough energy to move thru the solid (in metals, promotion from conduction-band directly). Backscattered electrons can also produce secondary electrons. Secondary Electrons By definition, these secondary electrons are <50 eV, with most <10 eV. a) Complete energy distribution of electrons emitted from target. Region I and II are BSE, Region III secondary. b) Secondary electron energy distribution, measured (points) and modeled (lines) (Goldstein et al, 1992, p. 107)
20 mm UW- Madison Geology 777 Secondary electrons are generated throughout the interaction volume, but only secondary electrons produced near the surface are able to escape (~5 nm in metals, ~50 nm in insulators). For this reason, secondary electron imaging (SEI) yields high resolution images of surface features.These have grey-scales, though pseudo-coloring is sometimes done. SE images Pollen, cat flea, and Si nanowires on alumina sphere.
UW- Madison Geology 777 SE and BSE coefficients Coefficients for backscattered-electron (h) and secondary electron (d) as function of Z. Tilt of specimen from 90° beam incidence (q) is 0. E0=30 keV. Data from 1966; more recent views suggest the flat SE curve may be due to carbon contamination on specimen hindering SE escape. (Goldstein et al, 1992, p. 109)
Time K shell (=photoelectron) 1 L shell Blue Lines indicate subsequent times: 1 to 2, then 3 where there are 2 alternate outcomes 2 3 UW- Madison Geology 777 Inner-shell ionization:Production of X-ray or Auger e- HV electron knocks inner shell (K here) electron out of its orbit (time=1). This is an unstable configuration, and an electron from a higher energy orbital (L here) ‘falls in’ to fill the void (time=2). There is an excess of energy present and this is released internally as a photon. The photon has 2 ways to exit the atom (time=3), either by ejecting another outer shell electron as an Auger electron (L here, thus a KLL transition), or as X-ray (KL transition). (Goldstein et al, 1992, p 120)
UW- Madison Geology 777 X-ray Lines - K, L, M Ka X-ray is produced due to removal of K shell electron, with L shell electron taking its place. Kb occurs in the case where K shell electron is replaced by electron from the M shell. La X-ray is produced due to removal of L shell electron, replaced by M shell electron. Ma X-ray is produced due to removal of M shell electron, replaced by N shell electron. (Goldstein et al, 1992, p 121)
UW- Madison Geology 777 All possible K, L, M X-ray Lines (Originally Woldseth, 1973, reprinted in Goldstein et al, 1992, p 125)
UW- Madison Geology 777 X-ray Lines with initial + final levels NB:not Greek! L N L L (Reed, 1993)
UW- Madison Geology 777 There is some movement now to change the way X-rays are described, from the traditional Siegbahn notation (e.g. Ka1) to the the IUPAC (K-L3). (International Union of Pure and Applied Chemistry). This table is from their 1991 recommendation. Nomenclature of X-rays (Reed, 1993)
L3 2p3/2 933 ev L2 2p1/2 952 ev L1 2s 1097 ev K1 K2 K 1s 8979 ev UW- Madison Geology 777 X-ray energies, Cu for example Where do the values for characteristic x-rays come from: here are the numbers for Cu K x-rays: Subtract the energy of the L shell (binding) energy from that of the K shell (binding) energy, and you have the characteristic value. - 933 = 8046 ev (book says 8048) 8979 - 952 = 8027 ev (book says 8028)
UW- Madison Geology 777 Absorption Edge Energy Edge or Critical ionization energy: minimum energy required to remove an electron from a particular shell. Also known as critical excitation energy, X-ray absorption energy, or absorption edge energy. It is higher than the associated characteristic (line) X-ray energy; the characteristic energy is value measured by our X-ray detector. Example: Pt (Z=78) X-ray line energies and associated critical excitation (absorption edge) energies, in keV
UW- Madison Geology 777 Absorption Edge Energy Edge or Critical ionization energy: minimum energy required to remove an electron from a particular shell. Also known as critical excitation energy, X-ray absorption energy, or absorption edge energy. It is higher than the associated characteristic (line) X-ray energy; the characteristic energy is value measured by our X-ray detector. Example: Pt (Z=78) X-ray line energies and associated critical excitation (absorption edge) energies, in keV
UW- Madison Geology 777 Overvoltage • Overvoltage is the ratio of accelerating (gun) voltage to critical excitation energy for particular line*. U = E0/Ec Maximum efficiency (cross-section) is at 2-3x critical excitation energy. • Example of Overvoltage for Pt: for efficient excitation of this line, would be (minimally) thisß accelerating voltage • La -- 23 keV • Ma -- 4 keV Example: Pt (Z=78) X-ray line energies and associated critical excitation (absorption edge) energies, in keV * recall: E0=gun accelerating voltage; Ec=critical excitation energy
UW- Madison Geology 777 Overvoltage • Overvoltage is the ratio of accelerating (gun) voltage to critical excitation energy for particular line*. U = E0/Ec Maximum efficiency (cross-section) is at 2-3x critical excitation energy. • Example of Overvoltage for Pt: for efficient excitation of this line, would be (minimally) thisß accelerating voltage • La -- 23 keV • Ma -- 4 keV Example: Pt (Z=78) X-ray line energies and associated critical excitation (absorption edge) energies, in keV * recall: E0=gun accelerating voltage; Ec=critical excitation energy
UW- Madison Geology 777 Fluorescence yield Fluorescence yield (w) is fraction of ionizations that yield characteristic X-ray versus Auger yield (a) within a particular family of X-rays. w + a =1 (Goldstein et al, 1992)
UW- Madison Geology 777 Fluorescence yield …can cause misunderstanding These are fractions, so each one is normalized to one. You cannot say anything about absolutedetected x-ray intensities. 2. Measured characteristic x-rays by WDS will additionally be a function of (a) the crystal diffraction efficiency, (b) the gas absorption efficiency, and c) the spectrometer sin theta position (distance between detector and sample). For example, from the above chart, you cannot predict whether Hf La or Hf Ma will have higher count rates.
Duane-Hunt Limit UW- Madison Geology 777 HV beam electrons can decelerate in the Coulombic field of the atom (+ field of nucleus screened by surrounding e-). The loss in energy as the electron brakes is emitted as a photon, the bremsstrahlung (“braking radiation”). The energy emitted in this random process varies up from 0 eV to the maximum, E0. On an EDS plot of X-ray intensity vs energy, the continuum intensity decreases as energy increases. The high energy value where the continuum goes to zero is known as the Duane-Hunt limit. Continuum X-rays The Duane-Hunt limit is very important to remember -- and utilize continuously!
Duane-Hunt Limit UW- Madison Geology 777 Kramer’s Law Kramer’s Law (or Relation) is a mathematical description (formula) for the background or continuum shape and intensity: I = constant x Z (E0 - E) / E Where I is the intensity of the continuum at any energy E, Z is atomic number and E0 is the accelerating voltage
UW- Madison Geology 777 Continuum and Atomic Number At a given energy (or l), the intensity of the continuum increases directly with Z (atomic number) of the material. This is of critical importance for minor or trace element analysis, and also lends itself to a timesaving technique (Mean Atomic Number,“MAN”).
UW- Madison Geology 777 X-ray units: A, keV, sin q, mm l = hc/E0 where h=Plancks constant, c=speed of light l = 12.398/E0 where is l is in Å and E0 in keV also, the 2 main EMPs plot up X-ray positions thusly: Cameca: n l = 2d sin q so for n=1 and a given 2d, an X-ray line can be given as a sin value (or 105 times sin q) JEOL: distance (L, in mm) between the sample (beam spot) and the diffracting crystal, i.e. L= l R/d, where R is Rowland circle radius (X-ray focusing locus of points) and d is interlayer spacing of crystal.
UW- Madison Geology 777 Moseley’s Relation Moseley (1913, 1914) found that there is a regular relationship between the atomic number of a material and its characteristic X-ray wavelength. l =B/(Z-C)2, where B and C are constants for each family of X-rays. (Goldstein et al, 1992, p. 123)
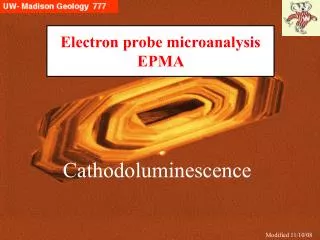
Cathodoluminesce When insulators and semiconductors are hit by HV electrons, long l photons (UV, visible, IR light) may be emitted. The light may be bright enough to be seen in the reflected light image (examples are benitoite, scheelite, zircon, corundum, diamond, wollastonite, YAG, GaAlAs). Incident electrons may promote valence shell electrons across the band gap to the empty conduction band, creating electron-hole pairs. With no bias to sweep the electron away, it will recombine with the hole. The excess energy (= gap energy) will be emitted as a long l photon. Impurity atoms as well as dislocations increase the possibilities for additional gap energies, yielding different wavelengths of emitted light.These may be valuable for production of diagnostic images.
UW- Madison Geology 777 CL Images Impurity atoms as well as dislocations increase the possibilities for additional gap energies, yielding different wavelengths of emitted light.These may be valuable for production of diagnostic images. CL is a cheap way to view overgrowths (inherited cores) and healed fractures in quartz and zircons. CL image of zircon from Yellowstone tephra (Lava Creek Tuff). Note faint oscillatory zoning surrounding sector-zoned core, and healed fractures. These are not visible in the BSE image. ~50 um grain. (courtesy Ilya Bindeman)
Electron interaction volumes Effect of beam interaction (damage) in plastic (polymethylmethacrylate), from Everhart et al., 1972. All specimens received same beam dosage, but were etched for progressively longer times, showing in (a) strongest electron energies, to (g) the region of least energetic electrons. Note teardrop shape in (g). Same scale for all. (Goldstein et al, 1992, p 80)
UW- Madison Geology 777 Ranges and interaction volumes It is useful to have an understanding of the distance traveled by the beam electrons, or the depth of X-ray generation, i.e. specific ranges. For example: If you had a 1 um thick layer of compound AB atop substrate BC, is EPMA of AB possible?
Electron and X-ray Ranges Several researchers have developed physical/mathematical expressions to approximate electron and X-ray ranges. Two common ones are given below. Electron range. Kanaya and Okayama (1972) developed an expression for the depth of electron penetration: RKO=(0.0276 A E01.67)/(r Z0.89) X-ray range. Anderson and Hasler (1966) give the depth of X-ray production as: RAH=(0.064)(E01.68 - Ec1.68)/ r where Ec is the absorption edge (critical excitation) energy. There are nomograms for these ranges, given on the next slides.
UW- Madison Geology 777 Ranges
UW- Madison Geology 777 Ranges From Will Bigelow, now emeritus U MI (Ann Arbor)
UW- Madison Geology 777 Monte Carlo simulations With the development of PCs, Monte Carlo simulations of electron-beam interactions have been very easy to perform. You can input your specific sample composition and run various “what if” scenarios, e.g. what is the maximum penetration of the electron beam through a thin film, or what is the smallest size crystal in a glass matrix that can be analyzed. You will be performing some of these MC simulations in a take home exercise. Each MC run has distinct conditions: specific E0, specific composition (Atomic wt and average Z), density, and potentially different tilt angle.
UW- Madison Geology 777 Specimen Heating Castaing (1951) derived the maximum temperature rise in a solid impacted by electrons of E0 energy and i current (in mA) and beam diameter d (mm): DT = 4.8 E0 i /kd where k is thermal conductivity (W/cmK). For E0=20 keV and 20 nA, d=1 um, in a metal (k=1), DT is 2 K. In a typical mineral (k=0.1), DT is 20 K. And in organic material, (k=0.002), DT is 1000 K! (e.g. epoxy) Difficult materials: carbonates, hydrated materials, halides, phosphates, glasses, feldspars. (Reed 1993, p 158)
UW- Madison Geology 777 1 nA of beam electrons = 10-9 coulomb/sec 1 electron’s charge = 1.6x 10⁻¹⁹ coulomb ergo, 1 nA = 1010 electrons/sec Probability that an electron will cause an ionization: 1 in 1000 to 1 in 10,000 ergo, 1 nA of electrons in one second will yield 106 ionizations/sec Probability that ionization will yield characteristic X-ray (not Auger electron): 1 in 10 to 4 in 10. ergo, our 1 nA of electrons in 1 second will yield 105 xrays. Probability of detection: for EDS, solid angle < 0.01 (1 in 100). WDS, <.001 ergo 103 X-rays/sec detected by EDS, and 102 by WDS. These are for pure elements. For EDS, 10 wt%, 102 X-rays; 1 wt% 10 X-rays; 0.1 wt % 1 X-ray/sec. ergo, counting statistics are very important, and we need to get as high count rates as possible within good operating practices. “Harper’s Index” of EPMA Acknowledgement: I first encountered this treatment at the Lehigh Microscopy Summer School
UW- Madison Geology 777 Sources of X-ray data • J.A. Bearden, 1964 (NBS; AEC) • White et al (“Penn State” 1965) tables • main lines in tables in Goldstein et al, and Reed texts • Probe for Windows database (includes higher order lines for WDS), also online at perry.geo.berkeley.edu/geology/labs/epma/xray.htm • NIST database: click on “X-ray Database” at bottom of page: www.cstl.nist.gov/div837/Division/outputs/DTSA/DTSA.htm • Lawrence Berkeley National Lab online at xdb.lbl.gov for data and how to order handy free reference book