Download
1 / 37
420 likes | 792 Views
Molecular and Genetic Epidemiology. Kathryn Penney, ScD January 5, 2012. Definitions. Genetic Epidemiology ‘a science which deals with the etiology, distribution, and control of disease in groups of relatives and with inherited causes of disease in populations’ - Morton, 1982

E N D
Molecular and Genetic Epidemiology Kathryn Penney, ScD January 5, 2012
Definitions • Genetic Epidemiology • ‘a science which deals with the etiology, distribution, and control of disease in groups of relatives and with inherited causes of disease in populations’ - Morton, 1982 • Molecular Epidemiology (www.aacr.org) • seeks to identify human (cancer) risk and (carcinogenic) mechanisms to improve (cancer) prevention strategies • is multi-disciplinary and translational, going from the bench to the field and back • uses biomarkers and state-of-art technologies to gain mechanistic information from epidemiological studies
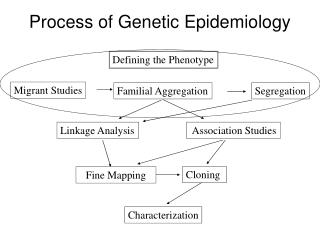
Genetic and Molecular Epidemiology Genetic variation Association? Disease Association? Association? Biological Factors/ Mechanism Exposure Disease
Twin studies • Determine if a disease has a genetic component • Estimate the genetic contribution to disease (heritability) • Genetics (heritable component) • Shared environment • Unique environment • Twins • Monozygotic (MZ) share 100% of their genes • Dyzygotic (DZ) share ~50% of their genes • Use correlation of trait/disease • RMZ = genetics + shared environment • RDZ = ½ genetics + shared environment • Genetics = 2 x (RMZ – RDZ)
Heritability Lichtenstein et al, 2000
Association studies • Family based • Parent-child trios, siblings • Population based • Case-control • Types of studies • Candidate gene/SNPs • Genome-wide association study (GWAS) • Single nucleotide polymorphisms (SNPs) vs. mutations/rare variants • Germline variation • SNPs > 1% population frequency A/A A/C A/C cases controls
Samples • Blood • DNA, RNA, biomarkers (dietary, hormones) • Tissue • Tumor and normal • DNA, RNA, proteins
Candidate genes • Select a gene of interest • Select SNPs to genotype • Literature • tagSNPs • HaplotypetagSNPs G/T G/T A/C A/C G/A G/A 1 2 3 4 5
Candidate genes • The International HapMap Project • Catalog of common genetic variants • Describes what these variants are, where they occur, and how they are distributed among people within populations and among populations
Candidate genes • www.hapmap.org • Haploview – visualize correlations between SNPs in HapMap or study data • Tagger – method to select tagSNPs in HapMap or study data
Candidate genes • Are the SNPs associated with outcome? • Are the SNPs associated with intermediate phenotypes/biomarkers/tumor markers?
Genotyping technology • Taqman • PCR-based fluorescent assay • Single SNP assay • Sequenom • PCR-based single-base extension • MALDI-TOF (Matrix-Assisted Laser Desorption/Ionization – Time Of Flight) • Multi-plex (≤36-40 SNPs) assay
Genome-wide Association Study (GWAS) • Estimated 10 million SNPs in the genome • Genotype 350k – 1 million SNPs across entire genome • Test association of each SNP with outcome • Adjust for the number of tests performed • p < 5x10⁻⁸ considered “genome-wide” significant • Replicate findings in a different population • Same SNP, same direction, approximate same magnitude of effect
GWAS results Amundadottir et al, 2009
Published Genome-Wide Associations through 6/2010, 904 published GWA at p<5x10⁻⁸ for 165 traits NHGRI GWA Catalog www.genome.gov/GWAStudies
Genotyping technology • Illumina • 1 million SNP chip • tagSNPs selected from HapMap data • Affymetrix • 1 million SNP chip • Selected based on distance http://www.illumina.com/Documents/products/technotes/technote_intelligent_snp_selection.pdf
Whole Genome Sequencing • Human Genome Project • First genome sequenced in 2000; project completed 2003 • 1000 Genomes Project • Goal: to create a complete and detailed catalogue of human genetic variation • Knome (founded by George Church and Harvard University) • knomeDiscovery – sequencing (30x) and interpretation for ~$5,000 • The Personal Genome • Interpretation (counseling?) • Screening? • High-risk groups? • Drug efficacy? • May help individuals alter behavior – but for now, we can’t do anything about our genes!
Genetic polymorphism Disease ??? Bias in Genetic Studies CONFOUNDING
Genetic polymorphism Disease Race/Ethnicity Bias in Genetic Studies CONFOUNDING
Population Stratification • Example: • Prostate cancer is more common in African Americans than in Caucasians • Frequency of many SNPs is different in African American and Caucasian populations • If we ignored race/ethnicity, what might happen in our study?
Population Stratification African American Caucasian Figure 1.The effects of population structure at a SNP locus.If the study population consists of subpopulations that differ genetically, and if disease prevalence also differs across these subpopulations, then the proportions of cases and controls sampled from each subpopulation will tend to differ, as will allele or genotype frequencies between cases and controls at any locus at which the subpopulations differ. The figure shows an example of this scenario with two populations in which the cases have an excess of individuals from population 2 and population 2 has a lower frequency of allele A than population 1. In this example, the structure mimics the signal of association in that there is a significant difference in allele and genotype frequencies between cases and controls. Marchini, 2004
Adjusting for Ethnicity • Defining & measuring ethnicity • Self-report • Ancestry (where are you grandparents from?) • Genotype many (hundreds) “ancestry informative markers” • Control for ethnicity • In design • Restrict to one ethnicity • Match on ethnicity • In analysis • Stratify by ethnicity • Include ethnicity in regression model
Misclassification • Non-differential • Of exposure: the degree of misclassification is the same according to disease status • Likelihood that exposure is wrong is similar among those who do and do not develop disease • Differential • Of exposure: The degree of misclassification varies according to the disease status
Misclassification • Laboratory tests do not always work perfectly – some % of samples may fail genotyping • Missing or incorrect exposure information • Non-differential or differential misclassification? • What can we do to ensure that the misclassification is non-differential?
Gene x Environment Interaction: An Example of Effect Modification Given equal exposure to the same risk factor, individuals may have different risk of disease depending on their genetic background • The effect of an exposure on a disease outcome is modified by genotype
Gene-environment interaction OR = 1 Stratify on genotype AA genotype AT/TT genotype OR = 1 OR = 2.25
Metabolism CYP1A1 DNA damage Lung Cancer GSTM1 Effect Modification is Biological
-Dozens of GWAS for many diseases have now been performed -Thousands of samples and hundreds of thousands of SNPs -Replication is necessary to determine which significant results are real -Once we know the results are real, then what??? GWAS follow-up EelesRA et al. (2008)
GWAS follow-up • Risk prediction model development • Understand biological function candidate genes/regions! • Some associated SNPs are not in gene regions • Many types of biological data and techniques can be employed to determine the function of the risk SNPs • Fine mapping • Expression (RNA and protein) • Enhancer activity
GWAS follow-up – 8q24 story A) Haploview output of the 1.18-Mb 8q24 "desert" showing the five cancer-specific regions reported to date Ghoussaini et al.
GWAS follow-up – 8q24 story 8q24 variation not associated with MYC mRNA expression in prostate tumor or normal tissue Pomerantz et al, 2009
GWAS follow-up – 8q24 story (a) ChIP assay on Colo205, demonstrating a pattern consistent with enhancer activity. (b) Luciferase reporter assay demonstrating enhancer activity in two CRC lines. Error bars denote one standard deviation from the mean of replicate assays. (c) Representative luciferase assay showing increased enhancer activity of G over T alleles, performed on a total of 18 clones (nine G and nine T over 3 d) (P = 0.024). Error bars denote one standard deviation from the mean of assays performed in triplicate. (d) Mass spectrometry plots from Sequenom analysis showing preferential binding of TCF7L2 to risk allele (G) in immunoprecipitated DNA, as evidenced by differential peak heights (right panel) compared to control input DNA (left panel) (P = 1.1 10-5). Pomerantz et al, 2009
GWAS follow-up (and beyond) GWAS results mRNA expression