Download

1 / 46
480 likes | 729 Views
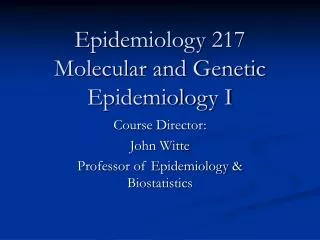
Epidemiology 217 Molecular and Genetic Epidemiology I. Course Director: John Witte Professor of Epidemiology & Biostatistics. Course Goals. Develop a framework for interpreting and incorporating genetic information in your research Learn: Common genetic measures

E N D
Epidemiology 217Molecular and Genetic Epidemiology I Course Director: John Witte Professor of Epidemiology & Biostatistics
Course Goals • Develop a framework for interpreting and incorporating genetic information in your research • Learn: • Common genetic measures • Approaches to search for disease-causing genes, and their interaction with environmental factors • Pharmacogenomics • Genetic testing, ethics.
Course Details • Class meets for 11 Tuesdays, 1:15 to about 3:15 pm • Course Director: John Witte, jwitte@ucsf.edu • Lecturers: • Iona Cheng, ICheng@crch.hawaii.edu • Tom Hoffman, HoffmannT@humgen.ucsf.edu • Eric Jorgenson, eric.jorgenson@ucsf.edu • Bernie Lo, bernie@medicine.ucsf.edu • Neil Risch, rischn@humgen.ucaf.edu • Joe Wiemels, joe.wiemels@ucsf.edu • Teaching Assistant: • Sarah Arron: ArronS@derm.ucsf.edu • website: www.epibiostat.ucsf.edu/courses/schedule/mol_methodsi.html (Lectures, homework assignments & keys)
Assignments • Four problem sets (50%) • Due at noon on Mondays to Sarah A. • Reading / class participation (20%) • ‘The Fundamentals of Modern Statistical Genetics’ by Nan M. Laird and Christoph Lange (Springer, 2011). Students may be called upon during class to answer questions about the assigned chapters. • Final project (design study) • 30% of grade (due Monday 3/14 at Noon) • Present to class
TICR Professional Conduct Statement • I will: • maintain the highest standards of academic honesty • neither give nor receive aid in assignments • not use answer keys from prior years • write in my own words • conduct research in an unbiased manner, reports results truthfully, and credit ideas developed and work done by others
Molecular & Genetic Epidemiology Distinction • Molecular: measurement of non-genetic factors in biospecimens (e.g., selenium in toenails) • Genetic: role of inherited factors in disease Focus of course • Genetic epidemiology • Initially studied single gene disorders • Now more complex genetic disorders and environment • Many designs same as epidemiology (e.g., case-control) • Some specialized analysis methods. • Population genetics increasingly important Aims • Detect genetic causes of disease • Understand biological process • Prevention strategies, lifestyle intervention • Improved therapeutic strategies, personalized medicine
Human Chromosome 21 Telomeres Centromere p: petit arm q: queue (tail) or long arm 21q22.1 is pronounced twenty-one q two two point one
Chromosome Bands • Stain chromosomes so they can be seen by microscope • e.g., Giesma stain (G-banding). • Appear as alternating bands • e.g., dark/G-band and light band. • Specific to phosphate groups of DNA. • Attaches to DNA regions with high adenine-thymine (A-T) bonding. • With low resolution, few bands seen: • … p2, p1 centromere q1, q2, … (count out from centromere). • With higher resolution sub bands seen: • … p12, p11 centromere q11, q12 …
Variation in Genome • Mutation • When event first occurs in an individual: • genetic change due to internal events (e.g., copy errors during cell division) or external agents (e.g., radiation, mutagens). • Can end with one generation, or be passed on (germline mutations) • But frequency remains < 1% in a given population • Polymorphism • Means "many forms“ • Frequency > 1% • Generated by old mutations. • ‘Common’ versus ‘rare’
T T G G T G T T G G T G A A A A A A C C C G C C Single Nucleotide Polymorphism (SNPs) • Change a single DNA letter • Most frequent genetic variant • 1/1300 base pairs • ~ 10 million common SNPs (> 1- 5% MAF) - 1/300 bp
Locus 4 Alleles at locus 4 Genotypes Each somatic cell is diploid (two copies of each autosome) Thus, 3 genotypes at locus 4
Noncoding • Coding Synonymous = no change in amino acid Nonsynonymous/nonsense = change to stop codon Nonsynonymous/missense = change amino acid MTHFR C677T SNP Normal (‘wild-type’) allele • Gene sequence …..GCG GGA GCC GAT……………… • Protein Sequence ……Ala Gly Ala Asp……………… • Variant allele • Gene Sequence …..GCG GGA GTC GAT………………. • Protein Sequence ……Ala Gly Val Asp ..…………… Types of Variants
Human Genome Statistics (old) • 3,253,037,807 basepairs • SNPs: 11,772,162 • 21,667 known genes • 1,040 pseudogenes (‘defunct’ genes) • 269,405 exons • Mutation rate ≈ 10-8 per bp per generation • In each person: • 65 new mutations expected • 1 variant per 1,331 basepairs • 2,444,055 variants • Most variants are old http://www.ensembl.org/Homo_sapiens
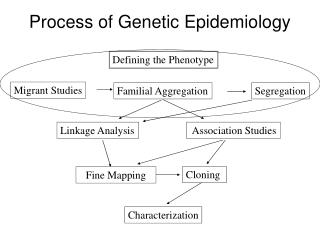
Process of Genetic Epidemiology Defining the Phenotype Migrant Studies Familial Aggregation Segregation Linkage Analysis Association Studies Cloning Fine Mapping Characterization
First: Define the Phenotype! Gleason DF. In Urologic Pathology: The Prostate. 1977; 171-198.
Migrant Studies Weeks, Population. 1999
Example: Standardized Mortality Ratios MacMahon B, Pugh TF. Epidemiology. 1970:178.
Familial Aggregation • Does the phenotype tend to run in families?
Analysis of Twin Studies • Compare the disease concordance rates of MZ (identical) and DZ (fraternal) twins. Twin 1 Concordance = 2A/(2A+B+C) Twin 2 Then one can estimate heritability of a phenotype.
Models of Genetic Susceptibility • Study families. • Estimate ‘mode of inheritance’ & what type of genetic variant might be causal. • Determine whether the disease appears to follow particular patterns across generations. • Estimate whether variants are rare or common, etc.
Segregation: Harry Potter’s Pedigree Muggle Wizard / Witch Vernon Dursley Lily Evans James Potter Petunia Dursley Harry Potter Dudley Dursley
Segregation Analysis • What is the best model of inheritance for observed families? • Dominant • Recessive • Additive • Disease allele frequency? • Magnitude of risk? • Fit formal genetic models to data on disease phenotypes of family members. • The parameters of the model are generally fitted finding the values that maximize the probability (likelihood) of the observed data. • This information is useful in parametric linkage analysis, which assumes a defined model of inheritance.
Process of Genetic Epidemiology Defining the Phenotype Migrant Studies Familial Aggregation Segregation Linkage Analysis Association Studies Cloning Fine Mapping Characterization
Linkage: Harry Potter’s Pedigree Measure co-segregation in pedigree Based on detection of recombination events (meiosis) Muggle Wizard / Witch Vernon Dursley Lily Evans James Potter Petunia Dursley or Harry Potter Dudley Dursley or
Affected sib-pair Linkage D M1 M2 D D M1 M1 M2
Association Studies ROCHE Genetic Education (www)
Linkage Disequilibrium Hirschhorn & Daly, Nat Rev Genet 2005
Affymetrix Array Genome-wide Association Studies (GWAS) Altshuler & Clark, Science 2005; 307:1052-3.
Multi-stage Study Designs Hirschhorn & Daly, Nat Rev Genet 2005
Admixture Mapping • Potentially powerful approach to searching for disease-causing genes • Requires: • Two populations with naturally occurring phenotypic and genetic differences. • Recent gene flow between the populations (e.g., within 10 generations). • Markers in the vicinity of the trait locus will also show excess ancestry from the population with the higher allele frequency
Admixture Mapping Nature Genetics 37, 118 - 119 (2005)
Summary of Main Mapping Approaches Nature Genetics 37, 118 - 119 (2005)
Cloning a Gene • Showing that it is clearly causal for disease. • Generally requires experiments beyond those undertaken by a genetic epidemiologist.
Characterization • Once genes are identified, molecular methods are used to determine the structure of the gene, identification of regulatory elements, etc. • Use epidemiologic studies to distinguish public health implications: • Determine frequencies of causal alleles; and • Characterize their effects—and interacting environmental factors—on disease rates.
Large RR ≠ Good Prediction Witte, Nat Rev Genet, 2009
Genetic Testing Based on GWAS? • Multiple companies marketing direct to consumer genetic ‘test’ kits. • Send in spit. • Array technology (Illumina / Affymetrix). • Many results based on GWAS. • Companies: • 23andMe • deCODEme • Navigenics
‘Test to Play’ NY Times, 11/30/08
Taste Project • Strips coated with Phenylthiocarbamide (PTC, or phenylthiourea). • Bitter or tasteless, depending on variants in the taste receptor TAS2R. • What do you think your phenotype is?