
Uploaded by
violet-mcintosh
2 SLIDES
104 VIEWS
20LIKES
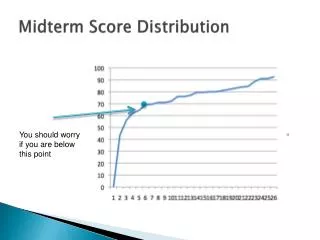
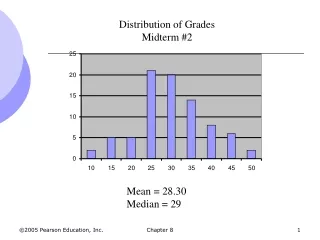
Midterm Grade Distribution Analysis for Class Evaluation
DESCRIPTION
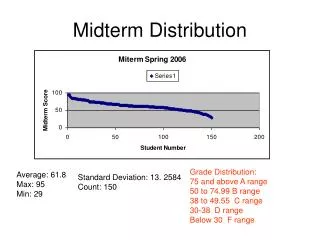
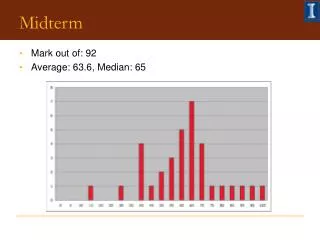
Analyzing midterm grade distribution to evaluate class performance, with average score of 61.8, max 95, min 29, and standard deviation of 13.
Download
1 / 2
Download Presentation 
Midterm Grade Distribution Analysis for Class Evaluation
An Image/Link below is provided (as is) to download presentation
Download Policy: Content on the Website is provided to you AS IS for your information and personal use and may not be sold / licensed / shared on other websites without getting consent from its author.
Content is provided to you AS IS for your information and personal use only.
Download presentation by click this link.
While downloading, if for some reason you are not able to download a presentation, the publisher may have deleted the file from their server.
During download, if you can't get a presentation, the file might be deleted by the publisher.
E N D
Presentation Transcript
Midterm Distribution Grade Distribution: 75 and above A range 50 to 74.99 B range 38 to 49.55 C range 30-38 D range Below 30 F range Average: 61.8 Max: 95 Min: 29 Standard Deviation: 13. 2584 Count: 150
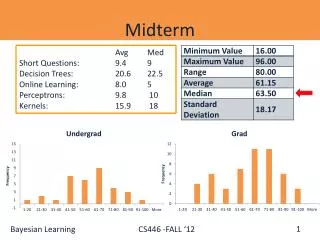
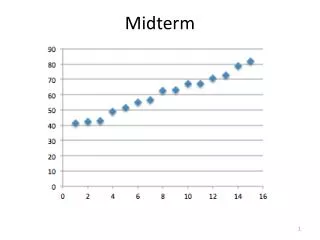
Class Distribution Grade Distribution: 27 and above A range 19 o 26.99 B range 14 to 18.99 C range 9 to 13.99 D range Below 9 F range Class Average: 23.45 Max: 31.62 Min: 8.7 Standard Deviation: 4.149 Count: 150 Students


More Related