Download
1 / 13
130 likes | 270 Views
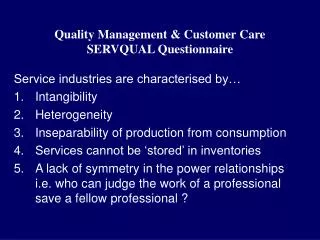
Evaluating IT Service Quality using ServQual. Janice El- Bayoumi CANHEIT 2012. TOPICS. Survey Methodology Development Principles Question Development Communication Plan Results for Service Owners Results for UNB Community Lessons Learned. Quality. SURVEY METHODOLOGY.

E N D
Evaluating IT Service Quality usingServQual Janice El-Bayoumi CANHEIT 2012 www.unb.ca/its
TOPICS Survey Methodology Development Principles Question Development Communication Plan Results for Service Owners Results for UNB Community Lessons Learned
Quality SURVEY METHODOLOGY
SURVEY DEVELOPMENT PRINCIPLES Survey Length Actionable Results Accountability / Transparency
EXAMPLES 1 – 7 scale. 1 is low, 7 is high Quality is 0 Meets expectations Expectation: Ranking is 7 Computers are configured to protect users work, identity and access from hackers and malicious software Perception: Ranking is 7 I am confident my computer was prepared to protect my work, identity and access from hackers and malicious software. Quality is +2 Exceed expectations Expectation: Ranking is 5 Copying and printing services are provided in a professional environment Perception: Ranking is 7 Imaging and Print Services facilities are professional. Quality is -4 Potential for Improvement Expectation: Ranking is 7 Phone calls are answered promptly. Perception: Ranking is 3 My phone calls were answered promptly.
COMMUNICATION PLAN • Survey Audience: Faculty and staff • Target Response Rate: 100 completed surveys • Channels: ITS Website, email, ITS blog, Twitter and Facebook, eNewletters, myUNB Portal, Inside UNB web page • Key Messages: • Feedback is important to identify areas for improvement • Results and improvement progress will be posted on the ITS website • Needed for UNB Quality Assurance program
LESSONS LEARNED Survey length Monitor participation Plan B promotion – extras that helped People don’t read Depersonalize questions Performance mgt and survey results Survey fatigue Survey structure
LIST OF SERVICES SURVEYED Faculty/Staff Internal Website Portal HelpDesk Email Support HelpDesk Phone Support Wired Internet Wireless Desktop Software Delivery Collaboration Tools IT Communications Telephony Administration Printing / Copying Content Mgt System Support Visual Design Support Shared Software License Delivery Students Internal Website Portal Printing/Copying Residence Internet Wireless Computer Labs Self-Serve Printing Collaboration Tools (email) IT Communication HelpDesk - Business Hrs. HelpDesk - After Hrs. Services for Tier 1 Support New computer Prep Hardware Repair IT Procurement Tier 2 Desktop Support Access Control Level 1 Liaison Support Network Support Printing Support Shared Sftwr License Support Data Storage Services Hardware Disposal Projects Portfolio Mgt Project Management Project Team Membership Business Analysis Development CMS Projects Student Tech Fee Project Server Support Consultation/Hosting Storage/Backup/Restore Contracted Services Tier 1 On-Site Support ECN (5 services)