Download
1 / 18
180 likes | 484 Views
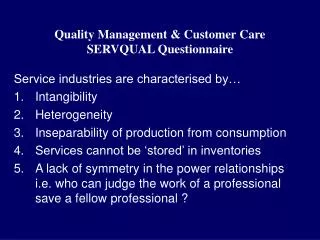
Evaluating IT Service Quality using ServQual. Janice El- Bayoumi CANHEIT 2012. TOPICS. The Improvement C ycle ServQual Survey Development Getting Participation Analysis Displaying Results Lessons l earned. SERVICE QUALITY IMPROVEMENT CYCLE. WHY SERVQUAL?.

E N D
Evaluating IT Service Quality usingServQual Janice El-Bayoumi CANHEIT 2012 www.unb.ca/its
TOPICS The Improvement Cycle ServQual Survey Development Getting Participation Analysis Displaying Results Lessons learned
WHY SERVQUAL? • Bell, Thomas J., and Smith, Thomas. The Assimilation of Marketing’s Service Quality Principles and the IT Auditing Process. In ISACA Journal. Volume 4, 2011.
SURVEY DEVELOPMENT PRINCIPLES Survey Length Actionable Results Accountability / Transparency
COMMUNICATION PLAN • Survey Audience: Faculty and staff • Target Response Rate: 100 completed surveys • Channels: ITS Website, email, ITS blog, Twitter and Facebook, eNewletters, myUNB Portal, Inside UNB web page • Key Messages: • Feedback is important to identify areas for improvement • Results and improvement progress will be posted on the ITS website • Needed for UNB Quality Assurance program
LESSONS LEARNED Question reviews Survey length Monitor participation Plan B promotion – extras that helped People don’t read Depersonalize questions Performance mgt and survey results Survey fatigue Survey structure
See our results at: http://www.unb.ca/its/about-its/it-services-quality/ THANK YOU