Download
1 / 23
230 likes | 375 Views
How Long Will This High Price Episode Last?. Special presentation for the IPAA Carl Calabro, Director, Market Analysis Markets Group June 16, 2005. Key Conclusions. The world is entering an episode of higher and more volatile prices than anything witnessed in the past two decades.

E N D
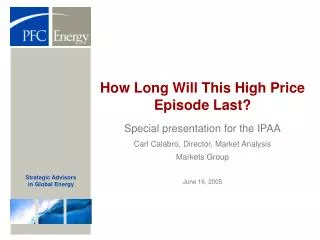
How Long Will This High Price Episode Last? Special presentation for the IPAA Carl Calabro, Director, Market Analysis Markets Group June 16, 2005
Key Conclusions • The world is entering an episode of higher and more volatile prices than anything witnessed in the past two decades. • The higher long-term prices are the result of a number of cyclical and structural factors coming together in the last two years. • This new price episode is likely to last few years, or until some of the cyclical trends are impacted by higher prices. • Higher prices will change the industry as profoundly as lower prices did after 1986.
Energy Security Re-Emerge as a Strategic Driver • In the aftermath of 9/11, security in the Middle East has reemerged as a key global concern. • The US presence in Iraq, and the avowed goal to “democratize” the region has raised the issue of the stability of a number of regimes in the Gulf. • Internal tensions, terrorist attacks in the GCC countries have heightened the perception of oil facilities being at risk. • Finally, the emergence of China as a large importer of Middle Eastern crude has added to the perception that a race to secure energy sources is emerging. • In a world dominated by security concerns rather than by globalization (pre 9/11), energy security has added a bullish factor to the perception of future prices, helping to lift the long term crude prices. • This is unlikely to change during the second Bush Administration, which remains focused on the war on terror.
$ HIGH PRICE Tight Refining & Tanker Capacity Hedge Funds Political Instability Stock Depletion Demand Growth Venezuela + Iraq OPEC’s Stock Management Setting the Stage in 2003 and 2004Chain Reaction In The Oil Market
When Structural And Cyclical Events Collide Oil Fundamentals Soaring Demand Cyclical Structural Low Supply Growth Cyclical Stretched Infrastructure: Refining Transportation Production Structural High prices OPEC Spare Capacity gone Structural Energy Security Structural Hedge Funds’ Role Structural Exogenous Elements
High Oil Demand Economic cycles and impact of high oil prices Stretch infrastructure creates bottlenecks High Oil Prices $$$ Flow Low Supply Growth OPEC Loose Excess Capacity Political Risks Highs Supply Anxiety Why The World Has $50 + Oil Several Factors Feeding Each Other In This New Episode
Global Economy Vs. Oil Demand World GDP, % Oil Demand % Growth Economy Underpins 5.0 % 4.0 % • Transportation • Urbanization • Industry 3.0 % 2.0 % 1.0 % 0.0 % 1990 1992 1994 1996 1998 2000 2002 2004 -1.0 % Its The Economy Stupid….The Key Cyclical Driver Oil demand growth remains tightly correlated to economic growth. The rise of Asian economies in the 1990’s has helped re-establish this relationship.
2000 2001 2002 2003 2004 2005 3.00 mmb/d 2.72 Other 1.83 Europe 1.84 US Other 1.50 Other US 0.76 Asia 0.68 0.66 Asia Asia Other Asia Asia Asia 0.9 % 0.9 % 1.0 % 2.4 % 3.4 % 2.2 % How Can The World Cope With This Growth? 6.4 million b/d Demand Strength Is The Key DriverBut Weaker Than 2004
Drivers Of Chinese GrowthSeveral Sectors Underpinning Product Strength Industry Industrial output is booming across the board Urbanization Increased household consumption Transportation Increasing car fleet, trucks shifting to diesel Asian Demand Growth Chinese Refinery Runs 1,500 kb/d Up 36% kb/d kb/d
US-Chinese Synergy Drives Up Diesel Demand The Axis Of Diesel Diesel Demand In the United States and China More Chinese Goods Exported To The US forecast mmb/d mmb/d Port of LA Incoming Cargo And Diesel Demand
Gasoline demand increased 8% between 2000 and 2005 People live farther away and use bigger cars US Product Demand Gives a Hand Gasoline Growth Slowing, Diesel Growth Has Created Problems US Gasoline Demand forecast 700 kb/d US Distillate Demand mmb/d 600 kb/d • Between 2000 and 2005 distillate soared with a 15% growth. • Transportation of imported goods throughout the country underpins diesel consumption. mmb/d
Refinery utilization in the Asia/Pacific market is the most stretched, as refiners try to meet Chinese demand. Next year will see the last round of significant specification changes for distillates in the US and Asia, and its impact on production should not be underestimated. 97% 96% 92% 95% 86% 89% 83% 60% 79% 57% Middle East Asia/Pacif FSU US EU Does not include teapot capacity in China Refinery Utilization Is Stretched FSU IS The Only Region With Significant Spare Capacity Average Yearly Utilization Rates In Selected Regions 2002 And 2004
Non OPEC Growth SluggishDecline Rates Hamper Growth Year-on-Year Growth In Non-OPEC Crude
mmb/d Historical Spare Production Capacity million b/d OPEC Has Lost Its Excess Capacity Spare Capacity Is A Luxury
OPEC Limited To Cash In High Prices Saudi Arabia Tries To Limit The Upside Losing Leverage To Control Marker Prices “ US Gasoline Market Is to Blame” “Fundamentals Are Tight” “ It is Speculator’s Fault” OPEC’s Mostly TalksSaudi Arabia Acts WTI Price And OPEC’s Arguments About It 2003 – 1st Half 2004 2nd Half 2004 - 2005 OPEC Performing “Stock Management” Strategy OPEC Willing To Bring Speculators To The Oil Markets
Discounts Of Arab Medium In Selected Markets Wrong Quality Spurs Soaring Discounts Why Is OPEC Not Able To Respond?Not The Right Crude Total Crude Supply, Left Axis vs. Sweet Crude Supply, Right Axis mmb/d mmb/d
Why Hedge Funds Are Flocking In?Sliding Dollar And Low Interest Rates Falling Dollar And Rising WTI Interest Rates and WTI $/d % • The recent rallies of the last three months are related to pouring money into the oil futures market by all types of investors. • Investment in commodities is a great opportunity to cash in in Asian growth, but a growing problem for the stability of oil prices
Increasing Interest In Far Out ContractsFlattening The Price Curve Price and Open Interest For WTI Futures • Funds have been putting their money on far out WTI contracts • It has pushed WTI prices well over $40/b through the end of the decade. • And Flattened the entire price curve, exacerbating the front-month contango in WTI and further weakening short-term fundamentals by encouraging further stock builds.
Eyes Focused On The 2nd HalfLittle Downside In The Short Term The Framework : Sliding Dollar, US Deficit Supply Anxiety for 4Q High Oil Demand Supply Anxiety Investors in need of hedging Stretched Infrastructure Investors willing to cash in the upside Mar Apr May Sep Dec
Building Stocks and Anxiety4Q Anxiety Keep Prices Strong 2005 Oil Demand vs. Price Curve Of WTI* right axis; $/b left axis: mmb/d The World Might Have Problems To Cope With Oil Demand In 4Q 2005 *WTI Futures Prices As Of April 14, 2005
Expensive oil may trigger investments in upstream or downstream, or may potentially affect demand in the long run. But the only short term element able to change the outlook is a potential economic meltdown. Refining 30 months 10 years Upstream Economic Impact Of High Prices 3 – 5 years Economic Meltdown 1 Month Higher Risk to Economic Downturn How Long Does It Take To React To High Prices? The Reaction Time Shows Asymmetric Risks Key low Impact High Impact
Inflation driving interest rates up trade deficit impacting $ value The Economic Cycle Has PeakedBut What Next Is Difficult To Predict Steroids Effects Waning Asian Banks Willing To Subsidize Forever? US Growth Is Slowing Growing By Borrowing Not Sustainable Adjustment of Imbalances is Necessary Managed adjustment Crisis Triggered Adjustment Slowdown Meltdown No country has managed to consume and invest 6% more than it produces for long. Oil Demand Slowing
Corporate Offices 1300 Connecticut Avenue, N.W. Suite 800 Washington, DC 20036 USA Tel: (1 202) 872 1199 Fax: (1 202) 872 1219 3, cité Paradis 75010 Paris, France Tel: (33 1) 47 70 29 00 Fax: (33 1) 47 70 27 37 Houston, Texas Tel: (1 281) 599 7099 Fax: (1 281) 599 9891 London, United Kingdom Tel: 44 (0) 1256 760678Fax: 44 (0) 1256 760678 info@pfcenergy.com www.pfcenergy.com