Download
1 / 1
10 likes | 189 Views
Pressure and flow waveform characteristics of seven high-frequency ventilators. Harcourt ER 1,2 , John J 3 , Dargaville PA 4 , Zannin E 5 , Davis PG 3,6 , Tingay DG 1,3,6

E N D
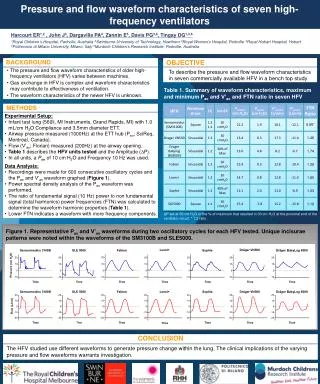
Pressure and flow waveform characteristics of seven high-frequency ventilators Harcourt ER1,2 , John J3, Dargaville PA4, Zannin E5, Davis PG3,6, Tingay DG1,3,6 1Royal Children’s Hospital, Parkville, Australia 2Swinburne University of Technology, Hawthorn 3Royal Women’s Hospital, Parkville 4Royal Hobart Hospital, Hobart 5Politecnico di Milano University, Milano, Italy 6Murdoch Children’s Research Institute, Parkville, Australia • BACKGROUND • The pressure and flow waveform characteristics of older high-frequency ventilators (HFV) varies between machines. • Gas exchange in HFV is complex and waveform characteristics may contribute to effectiveness of ventilation. • The waveform characteristics of the newer HFV is unknown. OBJECTIVE To describe the pressure and flow waveform characteristics in seven commercially available HFV in a bench top study Table 1. Summary of waveform characteristics, maximum and minimum Pao and V’ao and FTN ratio in seven HFV • METHODS • Experimental Setup: • Infant test lung (560li, MI Instruments, Grand Rapids, MI) with 1.0 mL/cm H2O Compliance and 3.5mm diameter ETT. • Airway pressure measured (1000Hz) at the ETT hub (Pao; SciReq, Montreal, Canada). • Flow (V’ao; Florian) measured (200Hz) at the airway opening. • Table 1describes the HFV units tested and the Amplitude (DP). • In all units, a Paw of 10 cm H2O and Frequency 10 Hz was used. • Data Analysis: • Recordings were made for 600 consecutive oscillatory cycles and the Paoand V’aowaveform graphed (Figure 1). • Power spectral density analysis of the Paowaveform was performed. • The ratio of fundamental signal (10 Hz) power to non fundamental signal (total harmonics) power frequencies (FTN) was calculated to determine the waveform harmonic properties (Table 1). • Lower FTN indicates a waveform with more frequency components. ΔP set at 30 cm H2O or the % of maximum that resulted in 30 cm H2O at the proximal end of the ventilator circuit. * 1:2 ratio Figure 1. Representative Pao and V’aowaveforms during two oscillatory cycles for each HFV tested. Unique incisurae patterns were noted within the waveforms of the SM3100B and SLE5000. CONCLUSION The HFV studied use different waveforms to generate pressure change within the lung. The clinical implications of the varying pressure and flow waveforms warrants investigation.