Download
1 / 38
400 likes | 758 Views
Ways to mitigate Transport Pollution. A S Bhal Economic Advisor, Ministry of Urban Development, government of India. Traffic in Our Cities - Jakarta. Traffic in Our Cities - Bangkok. Traffic in Our Cities – New York. Traffic in Our Cities – New Delhi. Traffic in Our Cities - China.

E N D
Ways to mitigate Transport Pollution A S Bhal Economic Advisor, Ministry of Urban Development, government of India
Increasing Urban Population World Statistics • Total Global population 7.09 billion • Urban Population – 3.4 billion • The population has been growing at an average 1.1% • Highest population in Asian Cities – 60% • India & China together account for 37% of the total population India Statistics • In 2011 - the population of India is 1.2 billion • 31% of population lives in urban areas • 53 cities have over a million population and eight metropolis cities (over 5 million population) Increasing city populations: Urban and rural population by development regions (in millions) Source: United Nations Population Division, World Urbanization Prospects, The 2009 Revision
Growing Congestion • Already 1.2 billion cars on road • Some forecast see 4 billion cars by 2050 • Average vehicle speed during peak hour is as low as 10 kmph • With growing GDP, modal share of motorized modes increasing In mostcities, mobilityisdominatedbypersonal motorizedtransport. Manypeoplechoosecarstomovearound…
Rising Energy Consumption The global energysystem 2010, (mtoe) Global Scenario • High Consumption of energy by the Transport Sector – 2377 Mtoe/ year (27.4%) only after building industry. • Source – 97% from non renewable sources India • Energy Consumption by transport sector – 80 Million Tons of Oil Equivalent (Mtoe)/ year • Growth in transport energy consumption of 38% between 2010-2035 (especially due to larger car and truck fleets) Source: IEA 2012 Indian energy system 2010, (mtoe)
Adverse Health Effects It has been estimated that 20 lakh Indians die annually due to air pollution. India is spending Rs 4,550 crore per year to treat health problems caused by air pollution • Concentrations of health-harming air pollutants in developing cities far exceed those in developed cities
Declining Road Safety • Worldwide, 13 Lakhs road deaths per year • Costs of road crashes and injuries estimated to be US$ 518 billion/year. • India, 5 Lakhs road deaths in 2011, growing at about 2.6% annually • MoRTH estimates 50% increase in accidents in 10 years in BAU scenario
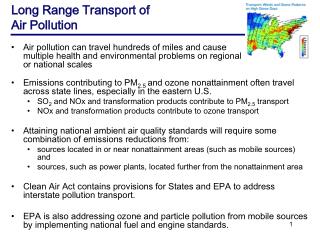
Air Polution & Carbon Emmision • Road transport is a major contributor to air pollution • Transport is responsible for 13 % of GHG emissions and for 23% of energy related emissions • As cities grow in size, transport emissions increase • Major types of air pollutants - Particulate matter, CO2, NOX etc • In developing cities, the most critical air pollutants are usually particulate matter and ozone Photo: HAP/Quirky China News / Rex Feat
Goals of Sustainability • Social: access for all sections of society to all activities necessary to participate in social life has to be guaranteed as far as possible • Economic: mobility of persons and of goods has to be provided without over-burdening the financial limitations of the public and private budgets • Environmental: rate of use of non-renewable resources should not exceed the rate at which renewable substitutes are developed
Sustainable Approach Social Sustainability Economic Sustainability Environment Sustainability
Mitigation Options • A practicalexample: The A-S-I approachappliedtoshopping
Basic Principles for Sustainable Urban Transport • The ASI approach does not only reduce emissions on a local and global level and improve energy efficiency • It also supports the vitalization of public spaces, social cohesion and economic attractiveness of a city
Travel efficiency Issues • Walk and Cycle facilities are generally missing • Public Transport is inadequate in quality and quantity • No effort to control transport demand • No Parking Policy • Accidents are increasing • Freight movement is not a part of urban transport planning Mitigation Measures • Priority to Non Motorized Transport • Support Public Transport • Land use Transport Integration • Travel Demand Management Measures ?
Non Motorized Transport • 10 bicycles = 1 car parking space • Bicycle tracks are very efficient - 5 times more people can move per hour on a bicycle track compared with a traffic lane
Priority to Public Transport (Source: Transport and Environment Report, Department of Ecology and Environment, Govt. of Karnataka)
Land Use Transport Integration Need to integrate transportation investments with development plans; and how transport can further the vision of future of our cities. Transit Orient Development (TOD) • compact, mixed use development near new or existing public transportation infrastructure. • Align density to availability of public transport • Ensure availability of affordable housing in close proximity to mass rapid transit nodes “Integrate land use and transport to create high density, mixed-use”
TDM Measures • Parking Management • Congestion Management • Speed reductions • Road Pricing • Priority for buses • Park & ride facilities • Pedestrian only areas • Public awareness
Vehicle Efficiency Major Issues Increasing Sales of Cars Rapidly growing use of diesel (in 2000: 4 % of car sales, now 50%) Quality of diesel in India does not meet the international standard Mitigation Measures BS (III) norms for fuels and vehicles implemented all over India BS(IV) norms for vehicles and fuels implemented in 12 cities Pollution under control certificate (PUC) for in-use vehicles Independent fuel testing laboratories for checking fuel adulteration Thrust on use of clean transportation fuel (CNG) in few cities Source: Based on SIAM data Source: Based on market data
Action Plan for Clean Air in Cities • Emission standards worldwide
Mitigation options for Indian cities • Improve Vehicle Technologies: Measures can be clustered into three categories • Improvement of existing vehicles • New fuel concepts • Development of new car concepts Technical options for improving the energy efficiency of LDVs
Link between local & global Issues • Sustainable transport instruments: Synergies between local air quality improvements and GHG mitigation
Options in Development of Cities Compact City Urban Sprawl • 60% of the population of Barcelona is within 600m of a subway line (99kms of subway lines and 136 metro stations) • To provide the same accessibility as Barcelona, Atlanta would have to build 3,400 km of metro line (compared to the current 74 km) and build 2,800 new railway stations.
Results of Urban Sprawl Road in New Delhi – Source: http://carimg.sulekha.com/automotive-albums/default/original/delhi_traffic_congestion.jpg
Effect of Shift ` SuburbanRail (e.g. Mumbai) BRT singlelane Mixed Traffic Regular Bus BRT doublelane Pedestrians Heavy Rail (e.g. Hong Kong) Cyclists LightRail 100 000 80 000 19 000 • 20 000 14 000 18 000 43 000 9 000 2 000 Pphpdon 3.5m widelane= pax / hour / direction Source: Botma & Papendrecht, TU Delft1991 and own figures
Transport & Environment CO2 emissions from passenger transport vs. modal split: Selected cities, different lifestyles ` Source: UITP
Breaking the Trend Energy consumption and transport By using the ASI approach cities increased the modal share of walking, cycling and PT and saw a decrease in the consumption of energy for passenger transport per capita. Source: UITP