Download
1 / 23
230 likes | 457 Views
Transport planning and air pollution. The approach in Ho Chi Minh City. Fouzi Benkhelifa. Environment Agency France. Dept of Sc. Tech. & Environment Ho-Chi-Minh-City. MC ownership. Background information on transportation. Ho-Chi-Minh-City Profile.

E N D
Transport planning and air pollution The approach in Ho Chi Minh City Fouzi Benkhelifa Environment Agency France Dept of Sc. Tech. & Environment Ho-Chi-Minh-City
MC ownership Background information on transportation Ho-Chi-Minh-City Profile • More than 2,000 km2 with nearly 7 mil. Inhabitants (< 10% of VN pop.) • Ho-Chi-Minh-City shares 20% national GDP • The average growth rate of GDP was 9.5% per year since 1995 • GDP per capita reached 1,460 USD in the year 2001. During 1990-2000, the annual average growth of the households who owned at least one motorcycle is 6.5%
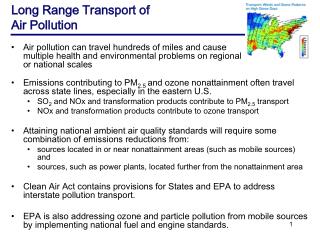
Morning Peak modal split (1996) • In peak hours, 68% of passenger trips is done by motorcycle Ho-Chi-Minh-City Transport Study – MVA Consultancy – January 1999 Background information on transportation • Others transportation modes • During 1995-2000, the number of cars and trucks increased 3 times. Number of seats in PT stay stable.
Air Quality Monitoring System in Ho-Chi-Minh-City Background information on air quality • Existing monitoring stations (MS) • 5 ambient air MS (2 automatics) • 4 roadside air MS (1 automatic) • 1 radio-active level MS • Monitored pollutants • Dust, SO2 • NOx, Lead, • CO and noise level
AQMS data SO2 Dien Bien Phu The monthly average concentration of SO2 is always higher than standard of daily concentration of World Health Organization (WHO) WHO Standard hourly average Hang Xanh VN Standard hourly average WHO Standard daily average WHO Standard daily average VN Standard daily average NOx The annual concentration of NOx is always higher than the VN standard of daily concentration. Even, the concentration recorded in the city center (Dien Bien Phu) is over the WHO permitted values per hour. Background information on air quality
Air Quality Index - AQI (transport and residential sector) Background information on air quality • AQI nearby traffic areas is always higher than that in the residential areas • AQI of transportation is 150-300 air quality nearby traffic road represents a high medical risk on the population
The need for an integrated approach Requirements for an explanatory tool/model : • Based on local actual data • Multi-sector based • Pedagogical : clear and easy to be understood • Geographical information • Allows to define targetting actions
cell c1 district h cell d3 district b cell b2 district a Geo-coding of the data by cell and area Stationary and mobile energy balance and pollutants emission loads determining factor matrix ETAP Pathway presentation Trafic Counting – Transportation Matrix energy balance pollutants load pathway Pollution mapping by determining factor
Transport sector consumes 19% of total fuel, but emits 61% NOx, 84% CO and 94% HC • Motorcycle response for 70% CO, 93% HC and 92% VOC emission A Multi-sector analysis
Multi-factor analysis Mapping of average speed of motorcycle in intra-district
Mapping analysis Mapping of VOC emission for transport sector
A worrying trend Two visions for the City Urban planning
Emissions standards NOx – Individual Cars – Diesel (inf to 2l.) NOx – Individual Cars – Diesel (inf to 2l.) Pre-Regular (before 1991) EURO IV (to be implemented in 2005)
Overall efficiency A larger choice
S1 ‘do-minimum’ PT S2 Improved PT Present emissions Local level Urban planning options Emission standards options NO- EURO enforcement EURO enforcement NO- EURO enforcement EURO enforcement ? ? ? Emission level for 2020 Strategies : which options ?
CO CO2 VOC NOx 0% -20% -40% -60% -80% -100% Urban planning Comparison of emissions level / S1-S2 scenarios (2020) (base case S1 - 2020 - NO-EURO) Urban planning effect (UPE) UPE + EURO enforcement effect
389 t/day 1258 t/day 132 t/day 290 t/day Urban planning ? NO-EURO S1- ‘Do Minimum’ Public Transport S2- Improved Public Transport ? EURO
La nécessité du renforcement des TC • Concertation : Groupe de travail inter-service sur l’amélioration des transports collectifs • Contribution aux résultats suivants: • mise en place de mini-bus scolaires • carte d’abonnement mensuels • renforcement des capacités de l’AOT • identification et soutien d’un projet de tramway
Urban Transport and Public Transport ManagementLe logiciel UTAM : un outil de gestion et d’optimisation du trafic de transport urbain
Results at the city level Part de marché actuellement autour de 8%, prévision entre 10 et 15% en 2012
End Thank you for your kind attention !!!