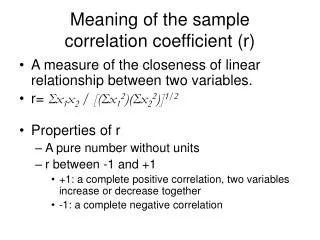
Correlation Coefficient (r)
Correlation Coefficient (r). Correlation. A statistical technique that is used to measure and describe a relationship between 2 variables Usually, the 2 variables are simply observed as they exist naturally in the environment (no attempt to control or manipulate the variables)

Correlation Coefficient (r)
E N D
Presentation Transcript
Correlation • A statistical technique that is used to measure and describe a relationship between 2 variables • Usually, the 2 variables are simply observed as they exist naturally in the environment (no attempt to control or manipulate the variables) • Correlation does not imply causation
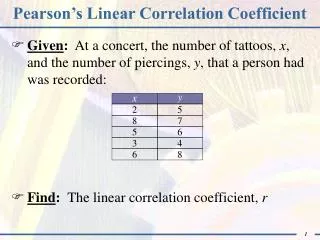
The Correlation Coefficient • rxy (also referred to as r)is the Pearson product moment correlation coefficient, invented by Karl Pearson in 1895. For simplicity’s sake, it is called the correlation coefficient. • r is the standard measure of both the degree and the direction of the relation between two variables that are measured on at least an interval scale.
Direction of a Correlation Coefficient • Positive correlation: The relation between X & Y is such that as X increases, Y increases. • Negative correlation: The relation between X & Y is such that as X increases, Y decreases. X = predictor (IV) Y = criterion (DV) X is graphed on the horizontal axis ( the abscissa) Y is graphed on the vertical axis ( the ordinate)
Strength of a Correlation Coefficient • Strength of a correlation = the extent to which two or more variables are related. • In the limit, variables are either not correlated (0.0) or perfectly correlated in a positive fashion (1.0) or in a negative fashion (-1.0). • Hence, the strength of a correlation can take any value from 0 to 1, and the specific correlation value, r, can take any number from -1 to 1.
Strength of a Correlation Coefficient • As a rule of thumb, the strength of a correlation is defined as follows: • Strong correlation: r=0.5 or greater • Moderate correlation: r=0.3 – 0.49 • Weak correlation: r=0.1 – 0.29
Form of a Correlation Coefficient • Linear correlation = varying the level of one variable will have a constant effect on the other variable. • A perfectly linear and positive correlation may look as follows: Y X
Form of a Correlation Coefficient • Curvilinear relation = varying the level of one variable will have a non-constant effect on the other variable. • Such a correlation may look as follows: Y X
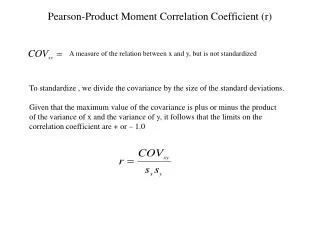
Conceptual Formula for r • r = degree to which X and Y covary/degree to which X and Y vary separately
Formula for Correlation Coefficient (z-score formula, parameters are known) • r = ∑ ZXZY N Where r=correlation coefficient ZX = standard score of X, the predictor variable ZY = standard score of Y, the criterion variable N = sample size ∑ = sum of This formula is used when the population standard deviation, σ, is used to determine the z-scores.
Formula for Correlation Coefficient (z-score formula, parameters are unknown) • r= ∑ ZXZY N - 1 Where r =correlation coefficient ZX = standard score of one observation’s score on X, the predictor variable ZY = standard score of one observation’s score on Y, the criterion variable N = sample size ∑ = sum of • This formula is used when the sample standard deviation, s, is used to determine the z-scores. • This is the formula that SPSS uses.
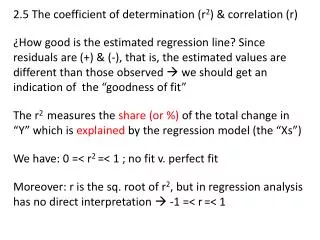
More on r • From the previous two formulas, it can be seen that the correlation coefficient, r, is the degree of correspondence between the standardized scores of two variables. • Standardized (z) scores are used to account for the fact that the two variables may have been measured using different measures (e.g. height in inches vs. weight in pounds). • Hence, r is a measure of the standardized relation between two variables. • r2 measures the amount of variance in one variable that is accounted for by the other variable; called the coefficient of determination
Some Factors that Affect Correlation Coefficients • Range restriction • When a correlation is computed from scores that do not represent the full range of possible values • Outliers • An outlier is an individual with X and/or Y values that are substantially different from the values obtained for the other individuals in the dataset • Sample size • Correlations are unstable with small sample sizes
Hypothesis Testing with r • The hypotheses • ρ= 0; ρ≤ 0 • Ρ ≠ 0; ρ > 0 • Degrees of freedom • df = n -2 • The APA write-up • Age was significantly related to annual income, r = .65, n = 30, p < .05.
Some other correlation coefficients (besides the Pearson r): • The Spearman rank-order correlation • Used when both variables are measured on an ordinal scale • The point-biserial correlation • Used when one variable is numeric and the other is dichotomous • The phi-coefficient • Used when both variables are dichotomous
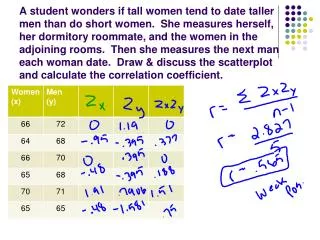
SPSS practice dataset…. • The ACT math and science scores (respectively) for 8 students are shown below. Compute r. • Student 1: 26, 24 • Student 2: 22, 24 • Student 3: 13, 10 • Student 4: 30, 31 • Student 5: 12, 17 • Student 6: 15, 15 • Student 7: 19, 21 • Student 8: 20, 16