Download

1 / 20
290 likes | 654 Views
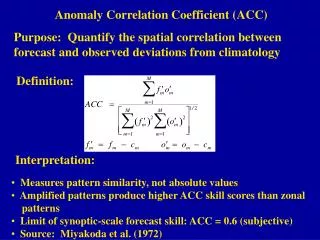
Product Moment Correlation Coefficient. Statistics 1. EDEXCEL. We used the following data for finding the equation of a regression line. The diagram of the data looked like this. Enter the data again into your calculator and this time look under regression for a value labelled r.

E N D
Statistics 1 EDEXCEL
We used the following data for finding the equation of a regression line The diagram of the data looked like this Enter the data again into your calculator and this time look under regression for a value labelled r.
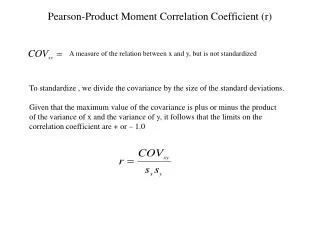
r is the product momentcorrelation coefficient. The product moment correlation coefficient measures the scatter of the data. Since these points all lie on the regression line we have perfect ( negative ) correlation.
The value of r, the product moment correlation coefficient, always satisfies . • If we have positive correlation and the regression line slopes from bottom left to top right. • If we have negative correlation and the regression line slopes from top left to bottom right. NOTES
If r=-1 or r= +1 we have perfect correlation and all the points lie on the least squares regression line. • For values of r close to -1 or +1 the correlation is strong and the points lie close to the line. • As values of r move towards zero, the correlation becomes weak. The points scatter further and further from the line. Strong correlation does not necessarily mean there is a causal relationship For example, the data we met earlier giving the populations of birds in woodland and farmland areas showed very little scatter about the regression line and hence strong correlation. However, it is most unlikely that the lack of birds in the woods causes a lack of birds on farms. Numbers in both cases are likely to be linked to availability of food.
Draw sketches showing about 10 points and a regression line for each of the following: (a) Data with perfect positive correlation (b) Data with strong negative correlation (c) Data with weak positive correlation (d) Data with weak negative correlation ( Work with a partner if you like and do 2 each. Help each other. ) Exercise
Solutions: Our diagrams are not going to look exactly alike. Try to decide if they have the same important feature. (a) Data with perfect positive correlation (b) Data with strong negative correlation
Solutions: (c) Data with weak positive correlation (d) Data with weak negative correlation
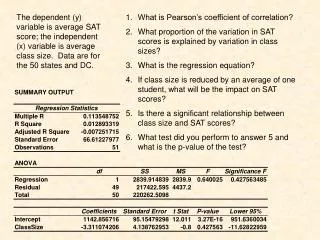
Foot length and height of UK children Foot length (cm) Height (cm) For the height and foot length data, the equation of the y on x regression line shown is and the product moment correlation coefficient is This value shows strong positive correlation. Taller children have bigger feet!
x 10 15 12 9 16 7 21 9 11 (a) y 4 9 8 5 14 4 9 11 14 x 1 2 3 4 5 6 7 8 (b) y 21 24 12 17 12 11 7 3 (a) Weak, positive Strong, negative (b) Exercise 1. Find the equation of the least squares regression line of y on x, and the value of the product moment correlation coefficient for the following sets of data. For each set, interpret the value choosing from the following words: “strong”,”weak”,”positive”,”negative”. Answer:
2(a) Using the bean data that we met before, find the product moment correlation coefficient. Weight (g) 0·7 1·2 0·9 1·4 1·2 1·1 1·0 0·9 1·0 0·8 Length (cm) 1·7 2·2 2·0 2·3 2·4 2·2 2·0 1·9 2·1 1·6 Source: O.N.Bishop (b) What does the answer to (a) tell you? ( You need to answer by using the mathematical words AND referring to the beans. ) (a) Answer: (b) There is a strong, positive correlation between weight and length. This means that the heavier beans are longer.
If you are not given raw data and you need to find the product moment correlation coefficient, you can use your formula booklet with summary data. The formula is where, as before and The formulae booklets also give r in a simplified form but it’s not very simple!
e.g.1 Find the value of the correlation coefficient for 10 pairs of observations relating 2 variables x and y where: Solution:
e.g.1 Find the value of the correlation coefficient for 10 pairs of observations relating 2 variables x and y where:
The following slides contain repeats of information on earlier slides, shown without colour, so that they can be printed and photocopied. For most purposes the slides can be printed as “Handouts” with up to 6 slides per sheet.
SUMMARY • The product moment correlation coefficient, r, measures the scatter of data. • The value of r, always satisfies . • If we have positive correlation and the regression line slopes from bottom left to top right. • If we have negative correlation and the regression line slopes from top left to bottom right.
If r=-1 or r= +1 we have perfect correlation and all the points lie on the least squares regression line. • For values of r close to -1 or +1 the correlation is strong and the points lie close to the line. • As values of r move towards zero, the correlation becomes weak. The points scatter further and further from the line. Strong correlation does not necessarily mean there is a causal relationship For example, the data we met earlier showed a high correlation between the number of birds in woodland and farmland areas, but it is most unlikely that the lack of birds in the woods causes a lack of birds on farms. Numbers in both cases are likely to be linked to availability of food.
For the height and foot length data, Foot length and height of UK children the equation of the y on x regression line shown is and the product moment correlation coefficient is This value shows strong positive correlation. Taller children have bigger feet!