Chi-Square and odds ratios
501 likes | 1.12k Views
Chi-Square and odds ratios. Semester Recap. We’ve covered: Descriptive Statistics Measures of Central Tendency Measures of Variability Z-scores and Graphing Association and Prediction Correlation Regression (simple and multiple) Testing for Group Differences

Chi-Square and odds ratios
E N D
Presentation Transcript
Semester Recap • We’ve covered: • Descriptive Statistics • Measures of Central Tendency • Measures of Variability • Z-scores and Graphing • Association and Prediction • Correlation • Regression (simple and multiple) • Testing for Group Differences • t-tests (one, indep., and paired) • ANOVA (One-way, factorial, ANCOVA, RM ANOVA • Statistical Concepts • Statistical Significance • Type I and Type II Error • Alpha and p-values • Beta and power • Effect Sizes
Last weeks… • All of the statistical tests on the prior slide are known as ‘parametric’ statistics • Parametric Statistics have strict assumptions that must be met before a t-test, correlation, etc… can be used • Assumes homoscedasticity of variance (variance between two variables are similar) • Assumes a normal distribution (bell-shaped curve) • These assumptions are not easily met • For example, we’ve used physical activity in several of our examples this semester – physical activity is RARELY normally distributed…
Nationally Representative Sample of Minutes of Daily Physical Activity Is this a normal distribution? What kind is it? Positive Skew PA
Additionally… • Sometimes you need to use a dependent variable that is categorical (grouping) • Recall from the chart that the statistical tests we’ve discussed all require 1 continuous dependent variables • Example Research Question: • Are there more male than female athletic trainers across the United States? • I want to know if there are more men than women – this is a nominal dependent variable • No correlation, regression, or ANOVA, etc… will help me answer this simple question
Non-Parametric Tests • Non-parametric tests can be used when: • Parametric tests statistical assumptions are not met • Categorical DV’s are used • Non-parametric statistics is an entirely different line of statistics that includes dozens of new tests • Usually a parametric test has a non-parametric ‘relative’ • Chi-Square Test of Independence is similar to Pearson Correlation • Most of the time if you can’t meet the assumptions of the parametric test you wanted to do – you can find an appropriate non-parametric test
Non-Parametric Tests (cont) • Non-parametric tests have benefits and drawbacks like all statistical tests • Benefits: • Assumptions are easier to meet • Non-parametric tests basically just need nominal or ordinal data • Remember that interval or ratio data scales can always be converted to nominal or ordinal – the inverse is not true • More ‘robust’ • Non-parametric statistics are more versatile tests • Recall small changes in our data required completely different parametric tests (e.g., the difference between a t-test and ANOVA) • Usually easier to calculate • We can realistically hand-calculate several non-parametric tests
Non-Parametric Tests (cont) • Non-parametric tests have benefits and drawbacks like all statistical tests • Drawbacks: • Less ‘mainstream’ • Non-parametric tests are commonly used – but far less frequently than parametric tests • Less powerful • By design, non-parametric tests have less statistical power… • What’s that mean? • Unless you NEED to use a categorical dependent variable, if your data meets the statistical assumptions you should use parametric stats
Tonight • We will discuss and use two non-parametric tests: • Chi-square test of independence • Logistic Regression (Odds Ratio) • These are the most common non-parametric tests • Both are related to each other (often used together) • Do NOT require normal distribution or homoscedasticity • Do require 2 categorical variables (nominal or ordinal)
Chi-Square, χ2 • There are actually a few different types of Chi-Square tests, we will discuss the Chi-Square test of independence • Test determines if two variables are related (or unrelated) • ‘Test of independence’ • Similar to Pearson correlation • For example, we would expect • Sex (Male/Female) is NOT related to hair color (dark/light) • Men and women are just as likely to have dark or light hair • Sex (Male/Female) is related to having a heart attack (Yes/No) • Men have more heart attacks than women do • For these tests, start thinking about data in 2x2 tables…
Chi-Square Data ‘Picture’ • A 2x2 table provides a nice summary of the data • In this example, ‘Sex’ is the IV and ‘Heart Attack’ is the DV • Does male/female increase risk of heart attack? • This table provides frequency of occurrence • Can also convert to percentage – you will get the same result
SPSS View • Data Structure: • Key variables are categorical • Can look at the data labels or values: • Males = 1 • Females = 2 • HeartAttack Yes = 1 • HeartAttack No = 2 • Look at Labels and Values:
SPSS View • Data Structure: • Key variables are categorical • Can look at the data labels or values: • Males = 1 • Females = 2 • HeartAttack Yes = 1 • HeartAttack No = 2
Chi-Square Data ‘Picture’ • You should fill out the margins of the table (how many men, women, total n, heart attacks, other causes, etc… • Do on board
How the Chi-Square works… • The χ2 test has a null hypothesis that there is no difference in the frequency of men/women having heart attacks • If the two variables are unrelated (independent), we would expect men and women to have the about same number • But, we need a statistical test to know if this difference is RSE
Then click on ‘statistics’ • It is CRITICAL you put the variables in the correct spots • Typically the IV goes in the Row • And DV goes in the Column It doesn’t really change the answer – but it makes it easier for you to understand the results
What else is there? • The ‘cells’ tab will allow you to request percentages in each cell, to go along with the frequencies • The ‘format’ tab will allow you to change the organization of your table • E.g., put ‘Females’ on the top row, or put ‘No Heart Attack’ in the left column
SPSS Output • SPSS provides two initial tables: • 1) Case Processing Summary: Ignore, repeat info of… • 2) CrossTabs Table (our 2x2): = Frequency. Could have asked for Percentages
Chi-Square Tests • We only care about the ‘Pearson Chi-Square’ – yeah, it’s that same guy from correlation… • Important info is the χ2 = 13.657, df, p, and n • χ2 = 13.66 is just like the t-statistic or r, or F ratio...
Chi-Square df • df is calculated by (number of columns – 1) multiplied by (number of rows – 1) • 2 rows – 1 = 1 • 2 columns – 1 = 1 • 1 x 1 = 1 df • All 2x2 tables have 1 df, more variables will change this
Reporting the results: • A chi-square test of independence was used compare the frequency of heart attacks between men and women. Sex was significantly related to having a heart attack. Men tended to have more heart attacks than women (χ2(1) = 13.66, p < 0.001). Questions on Chi-Square?
Logistic Regression • Researchers do often report just the Chi-Square test results. However, it is also common for them to incorporate logistic regression/or odds ratios • Quick definition of Logistic Regression: • Type of regression equation that uses a categorical DV • Such as heart attack yes/no from our example • It allows you to include any type of IV (categorical or continuous) – and any number of IV’s • In this sense, it is very similar to simple or multiple linear reg. • Instead of providing you with a slope – it provides an odds ratio for each IV
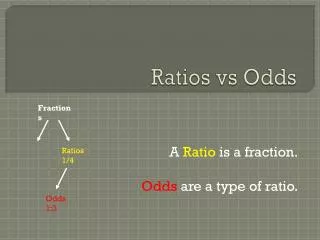
What are the odds…? • Odds • The probability of an event happening divided by the probability of the event not happening • Students often get confused here… • A die has 6 sizes, each with a difference number • On one die, the odds of rolling a 1 is…? • 1 side has a 1 on it, 5 sides do NOT • Odds of rolling a 1: • 1/5, or 20%
What’s an odds ratio…? • Odds Ratio • The odds of an event happening in one group divided by the odds of an event happening in another group • It is literally the ratio of two odds • It acts like effect size for a chi-square • The chi-square tells you if there is a difference – the odds ratio tells you how big/strong that difference is • If the chi-square is significant – the odds ratio is also statistically significant • Literal interpretation is how much more likely an event is to happen in one group versus another • It’s easier to see in our example…
Back to our example • What are the odds of a heart attack in men? • 68/32, or 2.125 • What are the odds of a heart attack in women? • 42/58, or 0.724
Back to our example • What is the ratio of these odds, or odds ratio? • 2.125 / 0.724 = 2.9 = OR • Interpretation: • Men are 2.9 times more likely to have a heart attack than women (we know it’s significant because of the χ2)
More on odds ratios • Interpreting odds ratios can trip up some students: • For example, 2.9 is the odds ratio for men vs. women • Men are 3 times more likely than women • Being a man is a ‘risk factor’ for heart attack • What is the odds ratio for women vs. men? • 0.724 / 2.125 = 0.34 • Women are one-third as likely to have a heart attack than men • Being a woman is ‘protective’ of a heart attack • Odds Ratios: • > 1.0 indicate an increased risk • < 1.0 indicate a decreased risk • = 1.0 indicate the SAME risk
Another Example: Lung Cancer • First, notice that way more women had lung cancer • But – there are way more women in this sample • I’ll run a chi-square in SPSS to see if there is a difference…
Lung Cancer Chi-Square results • χ2 = 2.451, df = 1, p = 0.456, n = 287 • Is there a difference in the frequency of lung cancer between men and women? • A chi-square test revealed that there was no significant difference in the odds of lung cancer between men and women (χ2 (1) = 2.451, p = 0.456). • Let’s calculate the odds ratio…
Odds Ratio: Lung Cancer • What are the odds of cancer in men? • 6/64 = 0.094 • In women? • 16/201 = 0.079 • What is the OR? Odds Ratio = 0.094 / 0.079 = 1.19 It appears men might be slightly more likely than women, but this could be due to RSE
More on Odds Ratios • 1) Take care in setting up your 2x2 table – this can make it really easy to calculate the odds and understand your chi-square or really hard • 2) As you can see we are hand-calculating an odds ratio. You can get SPSS to do this for you. • If you have only 1 IV (like these example), it’s called “Risk” in the CrossTabs option • Like simple linear regression
New Heart Attack Output • When you do this, ignore the bottom rows of the box (they are more confusing than helpful) • You get the OR and the 95% CI • This is the same result we got from hand calculating it, and we knew it was significant because of the chi-square test
95% CI’s and Odds Ratios • Is this odds ratio statistically significant? • How can you tell?
More on Odds Ratios • 2) As you can see we are hand-calculating an odds ratio. You can get SPSS to do this for you. • With 1 IV, use crosstabs • With multiple IV’s, use ‘logistic regression’
More on Odds Ratios • 2) As you can see we are hand-calculating an odds ratio. You can get SPSS to do this for you. • With 1 IV, use crosstabs • With multiple IV’s, use ‘logistic regression’ • 3) Odds Ratios can be tricky without the 2x2 table • They tell you how much more likely something is to happen for a certain group (like males vs females) • But, you should always include the information in the 2x2 table so people know what you’re talking about • Example…
Odds of Winning the Powerball • Odds of winning the Powerball lotto with 1 ticket: • 1 / 175,223,510 = 0.00000000571 • Odds of winning the Powerball with 10 tickets: • 10/175,223,510 = 0.0000000571 • Odds Ratio = 10.0 • You are 10 times as likely to win with 10 tickets!!!!! • Still better odds to die driving to buy your ticket – or getting hit by lightning – than winning with 10 tickets. • Odds Ratios are great statistics – but should not be used to model VERY, VERY rare things
Referent Group • 4) Odds ratios are a ratio between two groups • The odds ratio was 2.9 or 0.34 for our heart attack example – depending on which group was the referent • Referent Group = The ‘baseline’ group in the odds ratio. The group that is in the denominator. • 2.125 / 0.724 = 2.9 • Women were the referent group – meaning men were 2.9 times more likely than women • Must mention this when talking about your odds ratio – you can’t just say, ‘the odds ratio was 2.9’. • WHO was 2.9 times more likely than WHO? • This is especially important when using them for more than 2 groups…
Example with multiple groups • Odds ratios from a current study I’m working on • Shows compares the odds of obesity in children meeting recommendations for PA, screen time, sleep • Notice that WHO I choose to be the referent group influences all of the odds ratios
Upcoming… • In-class activity • Homework: • Cronk – Read Section 7.2 on Chi-Square of Independence • Holcomb Exercises 55, 56, 57 and 59 • Exercises 55-57 are on Chi-Square, 59 is on Odds Ratio