Download
1 / 22
220 likes | 430 Views
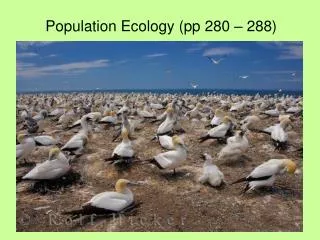
Population Ecology (pp 280 – 288). Learning outcomes. Define the biological term “population”. Describe the attributes that characterize population. Describe the factors that determine population structure. Interpret survivorship and population growth curves.

E N D
Learning outcomes • Define the biological term “population”. • Describe the attributes that characterize population. • Describe the factors that determine population structure. • Interpret survivorship and population growth curves.
Population - A population is a group of organisms which belong to the same species and live in the same location, e.g. all of the sperm whales living off the coast of Kaikoura. • Species - Males and females of a species are capable of breeding with each other and the offspring are fertile.
Attributes or Features of Population • Population size or Total abundance - number of members in a population. • Population range – the area in which members of a population are found. Boundaries are determined by limiting factors (these are usually environmental factors that a species needs to survive).
Attributes or Features of Population Population structure – determined by density, spacing/distribution and age structure.
Density • This is the number of individuals of a population per unit area/volume • e.g. tigers per square kilometre, mussels per square metre, paramecium per cubic ml of water, etc.
Distribution / Spacing • Random distribution – The presence of one individual does not directly affect the location of another individual. Uncommon in animals, but often seen in plants. • Clumped distribution – Individuals tend to stay in groups. • Regular or Uniform distribution – Occurs in species that keep and defend territories.
Age structure (pp 283-284) • The proportion or percentage of individuals in each age group in the population. • Population is usually divided into three groups: • * pre-reproductive • * reproductive • * post-reproductive
Survivorship (pg 286) • Some populations have many young but few survive e.g. fish, turtles • Some have few young but most survive to old age e.g. elephants, humans • In some populations the rate of loss is almost constant at all age groups e.g. rodents
Survivorship Curves • These are graphs that tell us how long individuals tend to survive in a population. • Type 1 – Mortality is low in early stages. • Type 2 – Mortality is relatively constant at all life stages. • Type 3 – Mortality is high in early life stages.
Type 1 Type 2 Type 3 Survivorship Curves
Population dynamics / change (pg 285) • Natality (birth rate) • Mortality (death rate) • Immigration (entering a population) • Emigration (leaving a population) • Population growth = • Births – Deaths + Immigration - Emigration
Population dynamics may be apparent from age structure • Pyramid shaped – increasing population • Bell shaped – stable population • Urn shaped (small at the bottom) – contracting population
Carrying capacity • All populations are capable of increasing in numbers as long as there are sufficient resources and other factors do not limit the population. • The size of a population present at any given time in an area is a balance between its reproductive potential and the environmental resistance. This balance is called the carrying capacity.
Reproductive potential – The maximum ability of organisms to reproduce themselves under optimum conditions. • Environmental resistance – amount of resources available in the environment, range of abiotic factors such as temperature, humidity, etc. • Carrying capacity – the maximum size of a population, determined by the interaction of the above mentioned two factors.
Population growth curves (pg 287) • The way a population grows is shown on a graph where the population size is plotted against time.
density-independent factors Catastrophic events Volcanic eruption, storms, floods, drought Physical Factors Rainfall, temperature, salinity, acidity Chemical pesticides Major habitat disruption (clear felling for logging, mining, oil spill etc.) Most are abiotic factors Population size is limited by: (pg 282) density-dependent factors • Disease • Predators • Parasites • Food supply • Intraspecific (within species) Competition • The greater the population, the greater effect these factors have. • Eg. Black plague in the Middle Ages – more deaths in cities
Factors affecting population distribution • Tolerance – ability to survive variation in environmental conditions. Optimum range: best environmental conditions for population Zone of physiological stress: uncomfortable but survivable. Lower/upper limit of tolerance: you die!
Acclimation • If conditions change slowly it is possible for the tolerance of an organism to change.
Factors affecting population distribution • Liebig’s Law of the Minimum ‘the functioning of an organism is limited or controlled by whatever essential environmental factor is present in the least favourable amount’ • Scurvy, bush sickness
Factors affecting population distribution • Geographical barriers Populations may not be present in a location just because they can’t get there due to a physical barrier such as ocean or mountain.