Chapter 52
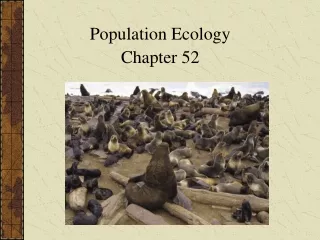
Chapter 52. pop Ecology. Overview: Earth’s Fluctuating pop's. To understand human pop growth, we must consider general principles of pop ecology. pop ecology- study of pop’s in relation to environ, including density & distribution, age structure, & pop size

Chapter 52
E N D
Presentation Transcript
Chapter 52 pop Ecology
Overview: Earth’s Fluctuating pop's • To understand human pop growth, we must consider general principles of pop ecology
pop ecology- study of pop’s in relation to environ, including density & distribution, age structure, & pop size • The fur seal pop of St. Paul Island, off the coast of Alaska, has experienced dramatic fluctuations in size
Concept 52.1: Dynamic biological processes influence pop density, dispersion, & demography • pop-grp of indiv's of 1 spp living in the same general area
Density & Dispersion • Density- # of indiv's per unit area or volume • Dispersion- pattern of spacing among indiv's w/in the boundaries of the pop
Density: A Dynamic Perspective • Determining the density of natural pop's is difficult • In most cases, it is impractical or impossible to count all indiv's in a pop • Density is the result of an interplay b/w processes that add indiv's to a pop & those that remove indiv's
LE 52-2 Immigration Births pop size Emigration Deaths
Patterns of Dispersion • Environmental & social factors influence spacing of indiv's in a pop
clumped dispersion- indiv's aggregate in patches • A clumped dispersion may be influenced by resource availability & behavior Video: Flapping Geese (clumped)
LE 52-3a Clumped. For many animals, such as these wolves, living in groups ↑'s the effectiveness of hunting, spreads the work of protecting & caring for young, & helps exclude other indiv's from their territory.
uniform dispersion- indiv's are evenly distributed • It may be influenced by social interactions such as territoriality Video: Albatross Courtship (uniform)
LE 52-3b Uniform. Birds nesting on small islands, such as these king penguins on South Georgia Island in the South Atlantic Ocean, often exhibit uniform spacing, maintained by aggressive interactions b/w neighbors.
random dispersion- position of each indiv is independent of other indiv's Video: Prokaryotic Flagella (Salmonella typhimurium) (random)
LE 52-3c Random. Dandelions grow from windblown seeds that land at random & later germinate.
Demography • Demography- study of the vital statistics of a pop & how they change over time • Death rates & birth rates are of particular interest to demographers
Life Tables • A life table is an age-specific summary of the survival pattern of a pop • It is best made by following the fate of a cohort • The life table of Belding’s ground squirrels reveals many things about this pop
Survivorship Curves • A survivorship curve is a graphic way of representing the data in a life table • The survivorship curve for Belding’s ground squirrels shows a relatively constant death rate
LE 52-4 1,000 100 # of survivors (log scale) Females 10 Males 1 2 0 10 6 8 4 Age (years)
Survivorship curves can be classified into 3 general types: Type I, Type II, & Type III
LE 52-5 1,000 I 100 II # of survivors (log scale) 10 III 1 100 50 0 Percentage of maximum life span
Reproductive Rates • A reproductive table, or fertility schedule, is an age-specific summary of the reproductive rates in a pop • It describes reproductive patterns of a pop
Concept 52.2: Life history traits are products of natural selection • Life history traits are evolutionary outcomes reflected in the development, physiology, & behavior of an organism
Life History Diversity • Life histories are very diverse • Semelparity- “big-bang” reproduction, reproduce once & die • Iteroparity- repeated reproduction, produce offspring repeatedly
“Trade-offs” & Life Histories • Organisms have finite resources, which may lead to trade-offs b/w survival & reproduction
LE 52-7 100 Male Female 80 60 Parents surviving the following winter (%) 40 20 0 Normal brood size Reduced brood size Enlarged brood size
Some plants produce a lg # of small seeds, ensuring that at least some of them will grow & eventually reproduce
LE 52-8a Most weedy plants, such as this dandelion, grow quickly & produce a large # of seeds, ensuring that at least some will grow into plants & eventually produce seeds themselves.
Other types of plants produce a moderate # of lg seeds that provide a lg store of energy that will help seedlings become established
LE 52-8b Some plants, such as this coconut palm, produce a moderate # of very large seeds. The large endosperm provides nutrients for the embryo, an adaptation that helps ensure the success of a relatively large fraction of offspring.
In animals, parental care of smaller broods may facilitate survival of offspring
Concept 52.3: The exponential model describes pop growth in an idealized, unlimited environ • It is useful to study pop growth in an idealized situation • Idealized situations help us understand the capacity of spp to ↑ & the cond’s that may facilitate this growth
Per Capita Rate of ↑ • If immigration & emigration are ignored, a population’s growth rate (per capita ↑ ) equals birth rate minus death rate
dN rN dt • Zero pop growth occurs when the birth rate equals the death rate • Most ecologists use differential calculus to express pop growth as growth rate at a particular instant in time:
Exponential Growth • Exponential pop growth- pop ↑ under idealized cond’s; J-shaped curve • Under these cond’s, the rate of reproduction is at its maximum, called the intrinsic rate of ↑
dN rmaxN dt • Equation of exponential pop growth:
LE 52-9 2,000 dN = 1.0N dt 1,500 dN = 0.5N dt pop size (N) 1,000 500 0 15 10 5 0 # of generations
The J-shaped curve of exponential growth characterizes some rebounding pop's
LE 52-10 8,000 6,000 Elephant pop 4,000 2,000 0 1920 1900 1980 1960 1940 Year
Concept 52.4: The logistic growth model includes the concept of carrying capacity • Exponential growth cannot be sustained for long in any pop • A more realistic pop model limits growth by incorporating carrying capacity
The Logistic Growth Model • logistic pop growth model- per capita rate of ↑ declines as carrying capacity is reached; sigmoid (S-shaped) curve • We construct the logistic model by starting w/ the exponential model & adding an expression that reduces per capita rate of ↑ as N ↑'s
LE 52-11 Maximum Per capita rate of ↑ (r) Positive N = K 0 Negative pop size (N)
(K N) dN rmax N dt K • The logistic growth equation includes K, the carrying capacity
LE 52-12 2,000 dN = 1.0N Exponential growth dt 1,500 K = 1,500 Logistic growth pop size (N) 1,000 dN 1,500 – N = 1.0N dt 1,500 500 0 0 15 10 5 # of generations
The Logistic Model & Real pop's • The growth of laboratory pop's of paramecia fits an S-shaped curve