Download
1 / 17
170 likes | 276 Views
Explore the impact of TV watching on childhood obesity through scientific, advocacy, and regulatory lenses. Understand causal implications without diagrams.

E N D
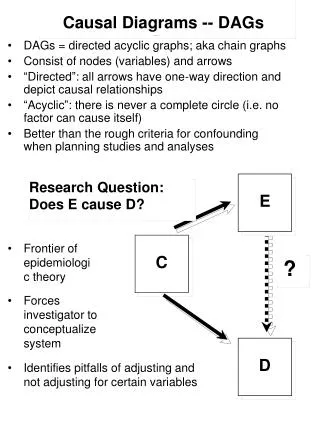
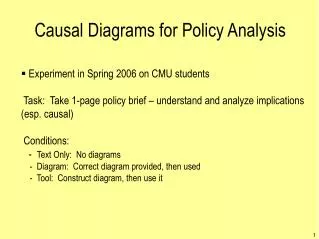
Causal Diagrams for Policy Analysis • Experiment in Spring 2006 on CMU students Task: Take 1-page policy brief – understand and analyze implications (esp. causal) Conditions: - Text Only: No diagrams - Diagram: Correct diagram provided, then used - Tool: Construct diagram, then use it
Text Childhood obesity is now a major national health epidemic. A number of facts are widely agreed upon by the public and scientific community: doing exercise decreases obesity, and eating junk food increases obesity. It's also clear that people who watch more TV are exposed to more junk food commercials. Parents for Healthy Schools (PHS), an advocacy group which fought successfully to remove vending machines from Northern Californian schools, claims that junk-food commercials on children's television programming have a definite effect on the amount of junk food children eat. In a recent press conference, Susan Watters, the president of PHS stated that "...if the food companies aren't willing to act responsibly, then the parents need to fight to get junk food advertising off the air." A prominent Washington lobbyist Samuel Berman, who runs the Center for Consumer Choice (CCC), a nonprofit advocacy group financed by the food and restaurant industries, argues that junk food commercials only "influence the brand of food consumers choose and do not not affect the amount of food consumed". While Mr. Berman acknowledges that watching more TV may cause people to see more junk food commercials, he remains strongly opposed to any governmental regulation of food product advertising. Recent studies by scientists at the National Health Institute have shown that watching more TV does cause people to exercise less.
Task Question: According the the NHI, will making children watch less TV decrease childhood obesity?
NHI Question: According the the NHI, will making children watch less TV decrease childhood obesity? Childhood obesity is now a major national health epidemic. A number of facts are widely agreed upon by the public and scientific community: doing exercise decreases obesity, and eating junk food increases obesity. It's also clear that people who watch more TV are exposed to more junk food commercials. Parents for Healthy Schools (PHS), an advocacy group which fought successfully to remove vending machines from Northern Californian schools, claims that junk-food commercials on children's television programming have a definite effect on the amount of junk food children eat. In a recent press conference, Susan Watters, the president of PHS stated that "...if the food companies aren't willing to act responsibly, then the parents need to fight to get junk food advertising off the air." A prominent Washington lobbyist Samuel Berman, who runs the Center for Consumer Choice (CCC), a nonprofit advocacy group financed by the food and restaurant industries, argues that junk food commercials only "influence the brand of food consumers choose and do not not affect the amount of food consumed". While Mr. Berman acknowledges that watching more TV may cause people to see more junk food commercials, he remains strongly opposed to any governmental regulation of food product advertising. Recent studies by scientists at the National Health Institute have shown that watching more TV does cause people to exercise less.
Diagram - Larkin, Simon (1987) computational offloading (via search) - Mayer, Moreno (2002) and distributed processing - Zhang, Norman (1994) Re-representation - Stenning, Oberlander (1995) Graphical constraining - Cox (1999), Ainsworth (2003) Promoting self-explanation ? Question: According the the NHI, will making children watch less TV decrease childhood obesity?
Tool iLogos Harrell (2005); Easterday, Kanarek, Harrell (in press) 6
external representation “deeper understanding” training training decrease obesity TV comprehension (default) solution obesity TV TV construction junk food obesity interpretation translation strategy “default” strategy “English” / high cost ER: text > diagram, tool “HCII” / complement: diagram ≥ tool > text “Teachers” /(Strong) Construction: tool > diagram > text answer policy text Comprehension
Sample - 63 CMU undergraduates enrolled in H&SS courses - 30 minute on-line reasoning lesson
Text Diagram Tool Experimental Setup Midtest (obesity) Training Pretest (environment) Posttest (crime) $10 Performance Learning
Tool (36%) Diagram (35%) Text (34%)
Diagram (49%) Text (41%) Tool (40%) Diagram >Text (p=0.04)
Tool (67%) Diagram (62%) Text (56%) Diagram >Text (p=0.04) Tool >Text (p=0.04)
30 minutes of training with diagrams helps policy analysis Conclusions 1-month of training helps statistical causal discovery 4 years of training Thomas Richardson!