Problem Definition and Causal Loop Diagrams
730 likes | 1.11k Views
Problem Definition and Causal Loop Diagrams. James R. Burns July 2008. Assignment. Complete exercise 12 and use VENSIM to create the CLD VENSIM cannot translate CLD’s into working simulations Develop the CLD for your term project problem. Problem Definition.

Problem Definition and Causal Loop Diagrams
E N D
Presentation Transcript
Problem Definition and Causal Loop Diagrams James R. Burns July 2008
Assignment • Complete exercise 12 and use VENSIM to create the CLD • VENSIM cannot translate CLD’s into working simulations • Develop the CLD for your term project problem
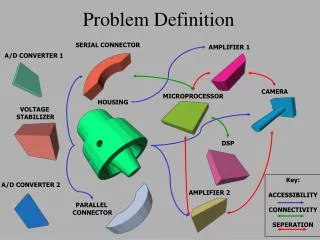
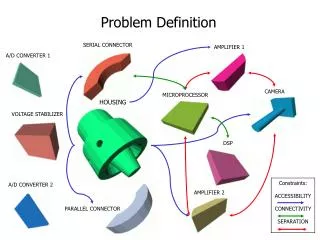
Problem Definition • The wrong model for the right problem is disconcerting, but fixable • The “right” model for the wrong problem is disastrous
The Right Problem • The first order of the day • Requires discussion, dialogue, listening • “I feel your pain”
The right paradigm • Is this a dynamic problem? • Are there risk aspects to it? • Is it a resource allocation problem? • A scheduling/routing problem? • A cost minimization problem? • APPLY THE RIGHT PARADIGM
Dynamic problems • There is change over time • The changing character of the situation IS THE PROBLEM • The problem should be studied in aggregates • The problem does not have a significant stochastic component or complexion to it
Start with descriptions of the following • PURPOSE • Identify who the decision-maker(s) are and involve them in the model-building process • PERSPECTIVE • PROBLEM • MODE
What are we doing here???? • Attempting to characterize, cope with and understand complexity • Especially DYNAMIC complexity, but also to a lesser extent detail complexity • Inventing a physics for a system or process for which there exists no physics • You get to become a Newton, a Liebnitz, a Galileo, an Einstein, a ….
WHY??? • How many of you have ever used a model to make a decision or take an action? • All decisions/executive actions are taken on the basis of models all the time • Because mental models frame and color our understanding of the problem—forcing us to take a particular course of action • Mental models must be driven by more formal, refined and analytical models—causal models/simulation models
Problem Problem SD Model Mental Model Mental Model Decision Decision Action Action
Uses to which these models can be put • What IF experiments—hands on experimentation • Decision making • Planning • Problem solving • Creativity • Out of the box thinking • Hypothesis testing • LEARNING
The Methodology once problem is identified • Find substance • Delineate CLDs, BOT charts • Submit these for outside scrutiny • Delineate SFD • Implement simulation in VENSIM • Submit for outside VALIDATION • Utilize model for policy experimentation
Find substance • Written material • Books • Articles • Policy and procedure manuals • People’s heads • Order of magnitude more here • Must conduct interviews, build CLD’s, show them to the interviewees to capture this
Delineate CLDs, BOTs • Collect info on the problem • List variables on post-it notes • Describe causality using a CLD • Describe behavior using a BOT diagram
Submit these for outside scrutiny • We simply must get someone qualified to assess the substance of the model
Delineate SFD • Translate CLD into SFD
Implement simulation in VENSIM • Enter into VENSIMPerform sensitivity and validation studies
Utilize model for policy experimentation • Perform policy and WHAT IF experimentsWrite recommendations
Key Benefits of the ST/SD • A deeper level of learning • Far better than a mere verbal description • A clear structural representation of the problem or process • A way to extract the behavioral implications from the structure and data • A “hands on” tool on which to conduct WHAT IF
Places where failure can occur • You must have decision maker involvement • If you are going to have an impact on their mental models, they must be involved in the model development process from beginning to end • Solutions to the model must be reality checked to see if in-fact they can become solutions to the problem
Motivation: CLD’s are excellent for… • Capturing hypotheses about the structural causes of the dynamics • Capturing the mental models of individuals or teams • Communicating the important feedbacks you believe are responsible for creating a problem
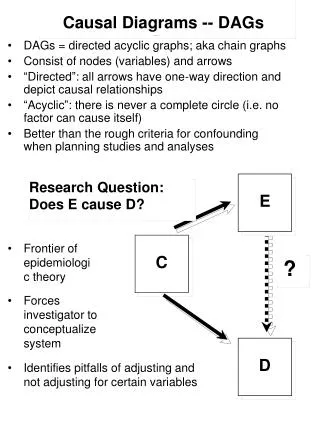
Notation • Variables and constants called quantities • Arrows—denoting the casual influences among the quantities • Independent quantity—the cause • Dependent quantity—the effect
Quantities • Use nouns of noun phrases • Assert nouns and noun phrases in their positive sense
The Connector • Also called “arrow,” “edge,” • Is always directed from a quantity to a quantity • Denotes causation or influence • Could be proportional • Inversely • Directly • Could be accumulative or depletive
Single-sector Exponential growth Model we considered • Consider a simple population with infinite resources--food, water, air, etc. Given, mortality information in terms of birth and death rates, what is this population likely to grow to by a certain time? • Over a period of 200 years, the population is impacted by both births and deaths. These are, in turn functions of birth rate norm and death rate norm as well as population. • A population of 1.6 billion with a birth rate norm of .04 and a death rate norm of .028
We Listed the Quantities • Population • Births • Deaths • Birth rate norm • Death rate norm
Using VENSIM TO CONSTRUCT CLD’s • Use the variable – auxiliary/constant tool to establish the quantities and their locations • Use the “arrow” tool to establish the links between the quantities • Use the “Comment” tool to mark the polarities of the causal edges (links, arrows) • Use the “Comment” tool to mark the loops as reinforcing or balancing
Experiments with growth models • Models with only one rate and one state • Average lifetime death rates • Models in which the exiting rate is not a function of its adjacent state
Example: • Build a model of work flow from work undone to work completed. • This flow is controlled by a “work rate.” • Assume there are 1000 days of undone work • Assume the work rate is 20 completed days a month • Assume the units on time are months • Assume no work is completed initially.
Solving the problem of negative stock drainage • pass information to the outgoing rate • use the IF THEN ELSE function
Validation of CLD’s • Clarity • Quantity existence • Connection edge existence • Cause sufficiency • Additional cause possibility • Cause/effect reversal • Predicted effect existence • Tautology
Motivation • In the current “environment” there are too many connection “opportunities” that confuse and invalidate models built by naive users • The conventional translation of CLD’s into SFD’s is not easy. • We may need to distinguish between Senge-style CLD’s created for just the purpose of capturing the dynamics of the process from CLD’s intended to lead us to a SFD
Robust Loops • In any loop involving a pair of quantities/edges, • one quantity must be a rate • the other a state or stock, • one edge must be a flow edge • the other an information edge
CONSISTENCY • All of the edges directed toward a quantity are of the same type • All of the edges directed away from a quantity are of the same type