Gene Expression Data Analyses (1)
Gene Expression Data Analyses (1). Trupti Joshi Computer Science Department 317 Engineering Building North E-mail: joshitr@missouri.edu 573-884-3528(O). Lecture Schedule for Gene Expression Analyses. Concept of microarray and experimental design for DNA microarray (9/6/05)


Gene Expression Data Analyses (1)
E N D
Presentation Transcript
Gene Expression Data Analyses (1) Trupti Joshi Computer Science Department 317 Engineering Building North E-mail: joshitr@missouri.edu 573-884-3528(O)
Lecture Schedule for Gene Expression Analyses • Concept of microarray and experimental design for DNA microarray (9/6/05) • Data transformation and normalization for DNA microarray (9/8/05) • Statistical analysis for DNA microarray andSoftware comparison (9/13/05) • Clustering Techniques for DNA microarray (Dr. Dong Xu 9/15/05)
Lecture Outline • Central Dogma of Molecular Biology • Introduction to Gene Expression and Microarray • Experimental Design
Lecture Outline • Central Dogma of Molecular Biology • Introduction to Gene Expression and Microarray • Experimental Design
Central Dogma of Molecular Biology Gene Expression mRNA level Protein level
Lecture Outline • Central Dogma of Molecular Biology • Introduction to Gene Expression and Microarray • Experimental Design
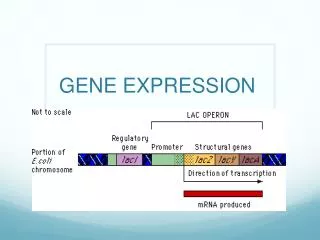
Introduction: Gene Expression Same DNA in all cells, but only a few percent common genes expressed (house-keeping genes). A few examples: (1) Specialized cell: over-represented hemoglobin in blood cells. (2) Different stages of life cycle: hemoglobins before and after birth, caterpillar and butterfly. (3) Different environments: microbial in nutrient poor or rich environment. (4) Diversity of life.
Microarray is about gene expression. • All information about living being is coded in DNA as a set of genes. • Each gene contains structural information about protein sequence and regulatory information about protein expression. • Intermediate step between gene and protein is mRNA. • The concentration of mRNA is measured by microarray.
Problem • RNA levels and protein levels are not always directly correlated. • No mRNA no protein; Relation is not simple and not universal. • Functional genomics fill the gap between gene expression and organism function. • The meaning of life is hidden in gene expression value but it is not easy to get it out.
Eucaryote Gene Expression Control nucleus cytosol inactive mRNA mRNA degradation control Primary RNA transcript DNA mRNA mRNA RNA transport control translation control transcriptional control RNA processing control protein protein activity control Microarray mRNAMass-spec protein nucleus membrane inactive protein
Principle of DNA Microarray • Complimentary hybridizationis the basis of RNA measurement. • Base-pairing rules • DNA: A-T and G-C • RNA: A-U, G-C, G-U A--T G--C T--A C--G
Microarray Technology • Macroarray: sample spot sizes >= 300 microns • Microarray: typically < 200 microns • biochip, DNA chip, DNA microarray, gene array, genome array, gene chip
Initial Ideas of DNA Microarray Immunoassay Ekins, R. and F. W. Chu. Microarrays: their origins and applications. Trends in Biotech.17: 217-218
Application of DNA Microarray Technology • Gene discovery • Biological mechanisms (gene regulatory network, etc.) • Disease diagnosis (cancer, infectious disease, etc.) • Drug discovery: Pharmacogenomics • Toxicological research: Toxicogenomics • Microbial diversity in the environment • …
Advantages and Disadvantages of Micoarray • Advantages: • High-throughput • Analyze gene expressions of different cells or from cells under different condition simultaneously • Disadvantages: • High noise • Relatively high cost
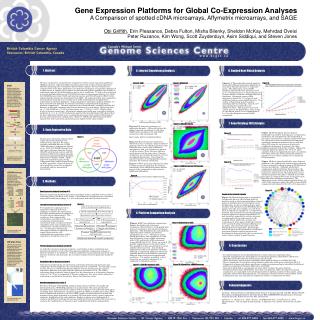
Categories of DNA Microarray • Probe based • cDNA microarray: cDNA (500~5,000 bases) as probe. 10,000-20,000 spots/slide. • Oligo microarray (Affimetrix Microarray): oligonucleotide (20~80-mer oligos) as probe. 200,000-500,000 spots/slide. • Dye based • Double label. For example, Cy3 and Cy5. • One sample is labeled with a “green” dye and the other with “red”. • Relative fluorescent intensity of red and green from the same spot. • Single label. • All samples are labeled with one color. • Absolute fluorescent intensity between different slides. • Does not control for the amount of DNA in each spot.
Chips • Typically a glass slide with cDNA or oligo • Printed by robot or synthesized by photo-lithography. • Typical arrays are 25x75 mm. Contains up to 500,000 probed gene fragments.
Probe Layout on Chips • Positive control • Genome DNA • House keeping genes • Negative control • Spots with cDNA from very different species • Blank spots • Spots with buffer • Samples • Technical replicates
Microarray Procedures Experimental Design Data interpretation RNA extraction cDNA prepration Statistical analysis Data transformation and Normalization Image Analysis cDNA labeling Sample mixing Scanning Hybridization
Molecular Interaction on microarray • 1 molecule per square angstroms • Large molecules are easily to be folded by themselves • Short targets are better than large targets to interact with tethered oligos • Ideally, target and probe should have the same length • Molecules interaction are dynamic • Competitive hybridization
Lecture Outline • Central Dogma of Molecular Biology • Introduction to Gene Expression and Microarray • Experimental Design
Experimental Protocol • A. Synthesis of cDNA Synthesis of the second strand DNA • B. Labeling • C. Hybridization • D. Scanning
Rational for Experimental Design • Scientific constrains: • Scientific aims and their priorities • Physical constrains: • Number of slides • Amount of mRNA • Goal of an optimal design: Minimize costs from money, time • Maximize the useful information
Issues for Experimental Design • Scientific • Specific questions and their priorities. • Practical (logistic) • Types of mRNA samples: reference, control, treatment. • Amount of material available (mRNA, slides, dyes). • Other factors • The experimental process before hybridization: sample isolation, mRNA extraction, amplification, and labeling. • Controls planned: positive, negative, ratio, and so on. • Verification method: northern blot, reverse transcriptase (RT)-PCR, in situ hybridization, and so on.
Variability and Replicates • Gene expression level for one gene in different slides may not be the same • Replicates: • Technical replicates: the target mRNA is from the same pool (RNA extraction) • Reduce variability • Biological replicates: the target mRNA is from different individual extraction. • Obtain averages of independent data • Validate generalizations of conclusions • Variation within technical replicates are smaller than that within Biological replicates
Graphical Representation of Design Cy5: red Cy3: green Cy3+Cy5: blue • Use directed graphs • Node: sample • Edge: hybridization, use Cy3 Cy5 • Weight: replicates
Direct & Indirect Comparison • Compared objectives: T and C • Directive design: TC are on the same slide • Indirect design: TR and CR are on the same slides, respectively. But T and C are on different slides
Variance & Std Deviation • Variance The most common statistical measure of variability of a random quantity or random sample about its mean. Its scale is the square of the scale of the random quantity or sample. • Standard Deviation Standard deviation is the square root of the variance. It measures the spread of a set of observations. The larger the standard deviation is, the more spread out the observations are.
Variance for Indirect Design • For sample T and C: • Differential Expression • Direct design • Indirect design αandβare means of log intensities across slides for a typical gene.
Dye-swapped Replication Dye-swapped replications Two sets of replications • Two hybridizations for two mRNA samples are on the two slides, but dye swapped. For example, Cy3 for A and Cy5 for the first hybridization (slide 1), then C5 for A and Cy3 for the second hybridization (slide 2). • Advantage: reduce systematic bias (e.g. dye bias)
Reference Design It may not be feasible to perform direct design when experimental conditions are more than 3.
Factors in the design • Single factor • Two factors • Multiple factors
Lecture Outline • Central Dogma of Molecular Biology • Introduction to Microarray • Application • Advantage vs. Disadvantage • Chips • Microarray procedure • Experimental design • Rational • Variability and Replication • Graphical representation • Direct comparison and Indirect comparison • Dye swap • Reference design • Single-factor design • Multifactorial design
Reading Assignments • Suggested reading: • Yang, YH and T. Speed. 2002. Design issues for cDNA microarray experiments. Nature Reviews, 3: 579-588. • Statistical analysis of gene expression microarray data. Chapter 2. pp. 35-92. Chapman&Hall/CRC Press, 2003.