Download
1 / 40
400 likes | 537 Views
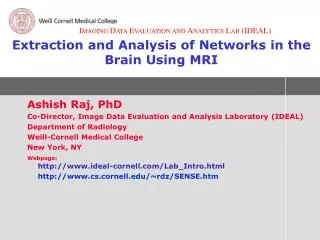
Extraction and Analysis of Networks in the Brain Using MRI. Ashish Raj, PhD Co-Director, Image Data Evaluation and Analysis Laboratory (IDEAL) Department of Radiology Weill-Cornell Medical College New York, NY Webpage: http://www.ideal-cornell.com/Lab_Intro.html

E N D
Extraction and Analysis of Networks in the Brain Using MRI Ashish Raj, PhD Co-Director, Image Data Evaluation and Analysis Laboratory (IDEAL) Department of Radiology Weill-Cornell Medical College New York, NY Webpage:http://www.ideal-cornell.com/Lab_Intro.html http://www.cs.cornell.edu/~rdz/SENSE.htm
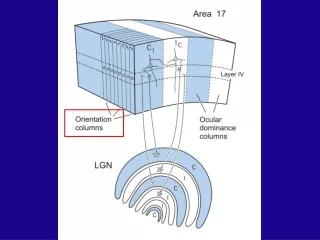
Part I:How to obtain networks from imaging data • Networks from biomedical imaging technologies: • Structural MRI • Functional MRI • Diffusion MRI – DTI, HARDI, DSI • MEG
Structural Brain Network from Fiber Tracing – Macaque Brain (Cocomac Project) MARCUS KAISER. Brain architecture: a design for natural computation. Phil. Trans. R. Soc. A, 2007.
Networks from fMRI • This is quite a mature field now • Friston, etc have proposed connectivity matrices from fMRI data • Parcellate cortex into ROIs • Each ROI has a time-resolved activation signal • Connectivity between 2 ROIs is given by the correlation between their temporal signals • This can show causal relationships – e.g. Granger causality
MR Diffusion Imaging • Diffusion MRI has revolutionized in vivo imaging of brain • Measures the directionally varying diffusion properties of water in tissue • Anisotropy of diffusion is an important marker of extant fiber organization • Enables probing of fiber connectivity in the brain, through tractography • D-MRI involves taking several directional diffusion imaging measurements • Then we fit a 3D shape to these measurements
High Angular Resolution Diffusion Imaging credit: P Mukherjee
Networks from Diffusion MRI • Obtain WM tracts from DTI/HARDI/DSI using tractography • From tracts terminating in cortical ROIs, estimate the strength of “connection” between them • Examples: Medina-Iturria in NeuroImage, Hagmann in PLoS One 2(7), etc • This gives the connectivity matrix, hence the network
Mapping Human Whole-Brain Structural Networks with Diffusion MRI Patric Hagmann, Maciej Kurant, Xavier Gigandet, Patrick Thiran, Van J. Wedeen, Reto Meuli, Jean-Philippe Thiran, PLoS ONE 2(7)
Lesson #1: graph edges are weighted and sometimes ambiguous • Almost all published work uses uniform edge weights • i.e. on/off connectivity • In real brain networks, connectivity between regions is sometimes ambiguous, blurry or noisy • Therefore the network you get may change according to the threshold! • Makes network analysis non-robust
Thresholding does not change small-world properties • We used statistics fully adapted for weighted networks, two definitions for clustering coefficient (by Onnela et al. and Grinrod-Zhang-Horvath) and wide range of tresholding parameters • The conclusion was always the same: The network has small-world property • -This is inline with previously published studies
Thresholding can change degree distribution statistics • Without thresholding normal distribution fits distribution of ROIs connectivity weights the best ROIs have comparable connectivity • With thresholding power law fits distribution of ROIs connectivity weights better
Lesson #2: Gaussian degree distribution • all nodes basically have same degree • no priviledged nodes ? • no hubs ?
Modeling Brain Diseases as Network Disorders • Brain-appropriate graph theory can be clinically relevant • This requires moving beyond applying social network methods to brain • Need to go back to first principles, testable models
Diffusion on Graphs and Relationship to Dementias c x x 12 2 1 R1 R2 Laplacian of the connectivity matrix “Signal”: amount of disease agent in neuronal population We model neurodegeneration as a diffusive process
Graph Diffusion Theory Note: this is graph-analogue of heat eqn Solution of heat equation given by This is easily computed via the eigen-decomposition of H: which gives Meaning that the solution of heat eqn is simply the sum of all eigen-modes ui of H
Most Persistent Eigenmodes of Graph Diffusion • We plot the 4 smallest eigenvectors of H • The smallest eigenvector = steady state distribution • This is simply prop to node size • The other small eigenvectors correspond to modes of diffusion that persist the longest • These modes might be primarily responsible for neurodegeneration • Larger eigenmodes will decay away quickly • These modes of propagation are transient and likely do not cause lasting widespread damage
Validation with dementia data Thanks to Yu Zhang and Duygu Tosun
Eigenmode 2 The 2nd eigen-mode of atrophy diffusion Measured atrophy pattern from Alzheimer’s subjects
Eigenmode 3 The 3rd eigenmode bvFTD atrophy pattern measured by volumetric analysis
Surface atrophy maps Measured atrophy using Freesurfer volumetrics
Surface atrophy maps Atrophy measured by SPM volumetric s/w
Clinical Implications • One of the first predictive, testable, mathematical models of spread of neurodegeneration • Eigenmodes can be used as feature vectors for automatic disease classification • Model is fully predictive • Can use baseline MRI to predict future atrophy • Just “play out” the diffusion kernel • Preliminary results promising
Scientific Implications • Eigenmodes modulate neurodegeneration • Model works reasonably even without any knowledge of differences in neuropathological mechanisms in various dementias • Is it possible that all dementias follow a spatial pattern given by the persistent eigenmodes of graph diffusion? • If true, would imply that there may not be much basis to point of origin studies • E.g. AD originates in hippocampus, etc
Whats Next? • A wonderful opportunity to study degenerative processes using graph theory and mathematical models • Turn neurological and pathophysiological knowledge into parsimonious math models • e.g. “network-diffusion” • Test these models against one another in a PRINCIPLED way • e.g. Bayesian model selection
Future plans Study other diseases to glean common features and universal models Other dementias Cruetzfeld-Jacob Parkinsons Non-degenerative diseases like Multiple Sclerosis, Epilepsy
Brain Networks in Health and Disease Ashish Raj, PhD Assistant Professor of Computer Science in Radiology Co-Director, Image Data Evaluation and Analysis Laboratory (IDEAL) Email: ashish@med.cornell.edu Webpage:http://www.ideal-cornell.com/Lab_Intro.html http://www.cs.cornell.edu/~rdz/SENSE.htm
Future work: CJD CJD provides an opportunity to study accelerated degeneration A good prototype for dementias New collaboration with Dr Geschwind Initial studies using SPM volumetrics - ??? Auto differential diagnosis b/n normal aging and CJD still possible
Part II:Brain-appropriate Graph Theory for Healthy brains • What kinds of questions can graph theory answer about the structure and function of healthy brains?
Clustering by normalized cuts reveals hierarchical organization of brain fibers
Clustering by normalized cuts reveals hierarchical organization of brain fibers • 8 parts • 2 parts • 4 parts • The clustering quality metrics indicated that division into 2 parts is the best for all clusters up to 3rd level ( 8 parts) • No major hubs detected at this resolution. Brain divides to: • Left and right hemisphere (2 parts) • Frontal and parts of parietal lobe; temporal, parietal, occipital lobe (4 parts)
Conclusions from Degree Analysis • There is no evidence for inverse power law distribution • The simplest description is provided by plain old Gaussian! • Brains are not scale free, there are no hubs • All cortical regions are roughly equivalent in terms of network topology • Inter-cortical connections are roughly equal, with random Gaussian variation around mean • Evidence for highly ordered hierarchical organization