
DO NOW
DO NOW. V: 0. TEKS. Motion Detector Lab. V: 0. Create recording table in your INB. Motion Detector Lab. V: 0. Motion Detector & Calculator Setup Review the setup procedures. Motion Detector Lab. V: 2. Students will be in groups of 4-5.

DO NOW
E N D
Presentation Transcript
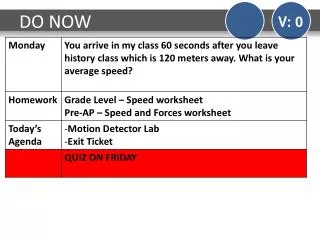
DO NOW V: 0
Motion Detector Lab V: 0 Create recording table in your INB.
Motion Detector Lab V: 0 Motion Detector & Calculator Setup Review the setup procedures.
Motion Detector Lab V: 2 • Students will be in groups of 4-5. • Create each graph using the motion detector. For better results, students can hold a whiteboard in front of them as they move. • Once you have the graph, show the teacher. The teacher must initial each graph before moving on. • Rotate jobs for each graph. - Motion Detector, Walker, Recorder, Guide
Exit Ticket V: 0 What should be included in a graph showing average speed?
DO NOW V: 0 distance time
Motion Detector Lab V: 2 Finish the Motion Detector Lab
Motion Detector Lab Questions V: 0 Answer the following questions in your INB. • Which two graphs were the most difficult? Why? • What is the significance of the horizontal line in a distance vs time graph? • What was different about the graph that is curved? What is the name of this type of motion?
Real World Scenarios V: 0 Graph the real world scenarios on the whiteboards. Ms. Gaffney is riding her bike to school. She starts downhill and goes 5 kilometers in 5 minutes. She then rides the next 10 kilometers to school in 15 minutes.
Real World Scenarios V: 0 Graph the real world scenarios on the whiteboards. Mr. Perry is quickly walking his dogs and they go 2 kilometers in 15 minutes. They then sit in the park and take a break for 15 minutes. They are feeling pretty good, so they decide to go for a run. They run 8 kilometers in 30 minutes.
Real World Scenarios V: 0 Graph the real world scenarios on the whiteboards. Ms. Morgan has a bought a new motorcycle and is going on a long trip. She rides 100 miles in 1.5 hours, then stops for lunch for 30 minutes. She continues on her journey traveling 200 miles in 2 hours.
DO NOW V: 0
Speed Challenge Lab V: 2 • Students will complete 4 different tasks. (Sprinting, Skipping, Speed Walking, Walking) • Calculate the average speed for each task. • Graph the average speed for each task.
Speed Graphs Foldable V: 0 Create a foldable that displays the graphs for different types of motion. • At Rest • Constant Speed • Speeding Up (Acceleration) • Slowing Down (Deceleration)
Speed & Velocity Video V: 0 Video What are the differences between speed and velocity?
Card Sort V: 2 Students will complete the card sort with their shoulder partner. Match the different speed graphs with the correct description.
DO NOW V: 0
Homework V: 0 Review Homework
QUIZ V: 0 Read and re-read the passage. Underline the question Bubble important words Identify the key idea, write it in margin. Eliminate the wrong answers Select the correct answer ✓ Mass of an object
Diamante Poem V: 0 Create a Diamante poem using the words “Speed” and “Velocity”.


