Utilizing JMP Scripts for Statistics Concepts Exploration
Discover the power of JMP scripts in exploring statistics concepts like relationship between mean and median, hypothesis testing, confidence intervals, and more. Hands-on activities and scripts provided for practical learning.

Utilizing JMP Scripts for Statistics Concepts Exploration
E N D
Presentation Transcript
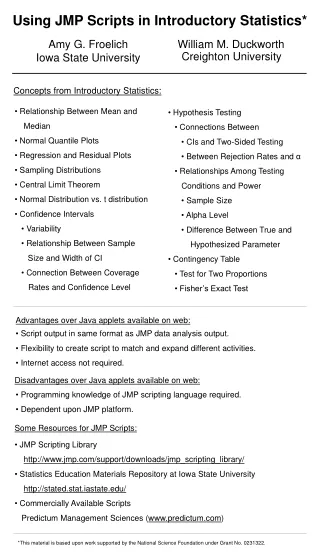
Using JMP Scripts in Introductory Statistics* Amy G. Froelich William M. Duckworth Creighton University Iowa State University Concepts from Introductory Statistics: • Relationship Between Mean and • Median • Normal Quantile Plots • Regression and Residual Plots • Sampling Distributions • Central Limit Theorem • Normal Distribution vs. t distribution • Confidence Intervals • Variability • Relationship Between Sample • Size and Width of CI • Connection Between Coverage • Rates and Confidence Level • Hypothesis Testing • Connections Between • CIs and Two-Sided Testing • Between Rejection Rates and α • Relationships Among Testing • Conditions and Power • Sample Size • Alpha Level • Difference Between True and • Hypothesized Parameter • Contingency Table • Test for Two Proportions • Fisher’s Exact Test Advantages over Java applets available on web: • Script output in same format as JMP data analysis output. • Flexibility to create script to match and expand different activities. • Internet access not required. Disadvantages over Java applets available on web: • Programming knowledge of JMP scripting language required. • Dependent upon JMP platform. Some Resources for JMP Scripts: • JMP Scripting Library • http://www.jmp.com/support/downloads/jmp_scripting_library/ • Statistics Education Materials Repository at Iowa State University • http://stated.stat.iastate.edu/ • Commercially Available Scripts • Predictum Management Sciences (www.predictum.com) *This material is based upon work supported by the National Science Foundation under Grant No. 0231322.
Inference for the Mean Population of 200 Female Heights Hands-On Activity: • Random samples from this population • Sample sizes = 10 and 20 • Two samples of each size per group • Sample Mean Height • Calculate 90% CIs for Population Mean Height • Conduct Hypothesis Test for Population Mean • Height Under True Null Hypothesis (α = 0.1) • Learning Outcomes • Discover variability of CI • Discover effect of sample size on CI width • Hypothesize about meaning of confidence • Hypothesize about Type I error and alpha level Confidence Interval Script: 100 95% CIs for the Population Mean Height • Replicates Hands-on Activity • Sample from Larger Population • 80%, 90%, 95% CIs • Population Mean Height of Females • Example Coverage Rates • 80% CI – 84/100 • 90% CI – 91/100 • 95% CI – 95/100 95 out of 100 CIs Contain the True Population Mean Height Hypothesis Testing Script: Type I error Replicates Hands-on Activity Ho: μ = μTRUE vs. Ha: μ≠μTRUE Vary: sample size (5, 25, 50) alpha level (0.1, 0.05, 0.01) Power Ho: μ = μFALSE vs. Ha: μ≠μFALSE Vary: sample size (5, 25, 50) alpha level (0.1, 0.05, 0.01) Value of μFALSE 100 z-test statistics with sample size = 25 and α = 0.05 100 z-test statistics with sample size = 25 and α = 0.05 4 out of 100 z-test statistics will reject Ho. 29 out of 100 z-test statistics will reject Ho.
Inference for the Proportion Hands-on Activity: Population of 200 Eye Colors • Random samples from this population • Sample sizes = 10 and 20 • Two samples of each size per group • Proportion of each sample with Blue Eyes • Calculate 90% confidence intervals for • Proportion in population with Blue Eyes • Learning Outcomes • Discover variability of CI • Discover effect of sample size on CI width • Hypothesize about meaning of confidence Confidence Interval Script: • Replicates Hands-On Activity • Sample from Larger Population • 90%, 95%, 99% CI • Proportion in Population with • Blue Eye Color • Example Coverage Rates • 89/100 – 90% CI • 97/100 – 95% CI • 98/100 – 99% CI 100 90% Confidence Intervals for Proportion of Population with Blue Eye Color 89 of the 100 Confidence Intervals Contain the True Proportion of Population with Blue Eye Color Plus 4 Method Confidence Interval Script: 100 95% Traditional CIs for Proportion of Population with Hazel Eye Color • Sample from Larger Population • Sample Size = 10 • 95% CI for Proportion in • Population with Hazel Eye Color • Compare Two Methods • Traditional • Plus 4 Method • Example Coverage Rates • Traditional: 81/100 • Plus 4 Method: 91/100 81 of the 100 Traditional CIs Contain the True Proportion of Population with Hazel Eye Color 100 95% Plus 4 Method CIs for Proportion of Population with Hazel Eye Color 91 of the 100 Plus 4 Method CIs Contain the True Proportion of Population with Hazel Eye Color
Randomization in the Design of Experiments Hands-on Activity*: Comparison of Mean Yields of Two Corn Varieties Convenience Assignment Alternating Assignment No significant difference in mean yields between two varieties. No significant difference in mean yields between two varieties. The Importance of Random Assignment: The “True” Yields Per Plot for Each Variety One Random Assignment of Varieties to Plots Variety A > Variety B by 12 bushels in each plot. Significant difference in mean yields between two varieties. Hypothesis Testing Script**: 100 t-test statistics when true difference = 12 bushels • Replicates Hands-on Activity • Random Assignments of Varieties to Plots • Distribution of Sample Mean Differences Between • Varieties • Number of Rejections of Null Hypothesis of Equal • Means • Vary: alpha level (0.05, 0.01) • true difference between Varieties A and B • Example Rejection Rates (α = 0.05) • 99/100 – True Difference = 12 • 43/100 – True Difference = 6 • 13/100 – True Difference = 3 99 out of 100 t-test statistics will reject Ho. 100 t-test statistics when true difference = 6 bushels 43 out of 100 t-test statistics will reject Ho. 100 t-test statistics when true difference = 3 bushels 13 out of 100 t-test statistics will reject Ho. * Original Activity Developed by W. Robert Stephenson and Hal Stern. See their article in STATS, Spring 2000, No. 28, 23-27. ** Programming Assistance provided by Mark Bailey, SAS Institute, Inc.