Download
1 / 19
190 likes | 292 Views
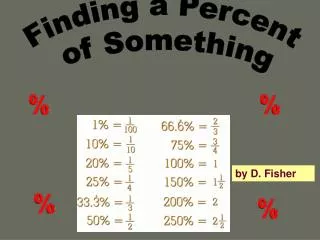
Explore application of Fisher Discriminate method to distinguish genuine particles from faked ones in CMS data with Pythia-produced samples and photonID cuts. Analyze ET distributions and track cuts impact to improve efficiency. Training Fisher with variables to reduce fake particles while retaining genuine ones effectively. Detailed results presented for QCD and g+jet events in barrel and endcap regions. Insights on optimizing particle identification process for better results at varying energy levels.

E N D
g’s and fake g’s in CMS: Application of a Fisher Discriminate Michael Anderson Kevin Flood March 18, 2009
Today • Plots/variables of g’s and jets leaving energy deposits similar to g’s • Results of Fisher multivariate to discriminate g’s and g’s faked by jets • Samples used: • Pythia-produced g+jetevents (signal) • Pythia-produced di-jet QCD events (background) • Event displays and energy-deposit pictures from cmsShow
g+jet Monte Carlo • ET distribution of DR matched grec in endcappassing either: • ET>20GeV, DR<0.1, and H/E<0.2OR • Same as above, plus Loose Photon ID cuts: • Official PhotonID has significantly reduced efficiency as ET(g) increases! Scaled to 200pb-1 -grec -grec passing photonID SEcal ET in 0.06-0.4 ring < 10 GeV SHcal ET 0.1-0.4 ring < 10 GeV STrackpT in 0.04-0.4 ring < 30 GeV R9 = E3x3/E(g) > 0.8 [slide 31 lists all PhotonIDconfig parameters]
g+jet Monte Carlo • ET distribution of DR matched grec in barrelpassing either: • ET>20GeV, DR<0.1, and H/E<0.2OR • Same as above, plus Loose Photon ID cuts: • Similar story in barrel – we can do better than this! Scaled to 200pb-1 -grec -grec passing photonID SEcal ET in 0.06-0.4 ring < 10 GeV SHcal ET 0.1-0.4 ring < 10 GeV STrackpT in 0.04-0.4 ring < 30 GeV R9 = E3x3/E(g) > 0.8 [slide 31 lists all PhotonIDconfig parameters]
Fisher Input • Trained Fisher with 10 variables to discriminate g’s and jets faking g’s: • (SEcal in solid 0.4 cone-ET(g)) / ET(g) • (SHcal in 0.1-0.4 ring) / ET(g) • (STrackpT in solid 0.4 cone) / ET(g) • H/E • R9 = E3x3/E(g) • E2x5/E5x5 • E3x2/E5x5 • Zernike Z20 (circular) moment • E-weighted f-width • E-weighted h-width • See appendix slides 31-34 to see distributions of these Cuts on both signal and background grec before training: H/E < 0.2 # Tracks in 0.4 Cone ≤ 2 20 GeV < ET < 1000 GeV Trained Barrel & Endcap separately, Barrel: |h| < 1.45 Endcap: 1.55 < |h| < 2.50
Fisher Response • In the barrel • In the endcap • Cut everything below dashed line • Statistics used:
Results for fake g’s • ET distribution of the grec from dijet QCD • Original (ET>20GeV, H/E<0.2, |h|<1.45) • After track cut (# Tracks≤2) • After Track&Fisher cut(FisherResp>0.05) • Only PhotonID cuts • Fisher Cut reducesQCD most in lowest ETbins (cuts millions of QCD) • Similar result for endcap [appendix slide 36] Scaled to 200pb-1 -grec(Original) -grec (# Trk ≤2) -grec (# Trk ≤ 2&Fisher cut) -grec (Photon ID)
Results for g’s • ET distribution of the grec from g+jet • Original (ET>20GeV, H/E<0.2, |h|<1.45) • After track cut (# Tracks≤2) • After Track&Fisher cut(FisherResp>0.05) • Only PhotonID cuts • First three overlap on graph • Most losses in lowest ET bins • Similar result for endcap [appendix slide 37] Scaled to 200pb-1 -grec(Original) -grec (# Trk ≤2) -grec (# Trk ≤ 2&Fisher cut) -grec (Photon ID)
Final g/fakeg Comparison • ET distribution of the grec in Barrel from • QCD (Highest grec in event) • g+jet events (the grecDR matched to ggenfrom hard scattering &passing cuts) • QCD (passing cuts) • Cuts: • # Tracks in solid 0.4 cone ≤ 2, • FisherResp>0.05 Scaled to 200pb-1 -grec (from QCD originally) -grec(from g+jet passing cuts) -grec (from QCD passing cuts)
Final g/fakeg Comparison • ET distribution of the grec in Endcapfrom • QCD (Highest grec in event) • g+jet events (the grecDR matched to ggenfrom hard scattering &passing cuts) • QCD (passing cuts) • Cuts: • # Tracks in solid 0.4 cone ≤ 2, • FisherResp>0.05 Scaled to 200pb-1 -grec (from QCD originally) -grec(from g+jet passing cuts) -grec (from QCD passing cuts)
Summary • Official Loose PhotonID cuts on ET isolation results in significant losses of g’s as ET increases • Instead: In a solid cone, require number of tracks ≤ 2 to remove majority of QCD yet retains majority of g’s • After cutting on number of tracks, training a Fisher with the 10 listed variables and cutting on the result: • Removed an additional ~70% of QCD while keeping 90% of g’s • Did not result in increasing g loss as ET increased • More work needs to be done for ET <200 GeV, where fake g’s still outnumber true g’s
Photon ID • These are parameters set for reco::PhotonID isolation calculations /RecoEgamma/PhotonIdentification/python/photonId_cfi.py: isolationtrackThreshold = cms.double(0.0), TrackConeOuterRadius = cms.double(0.4), TrackConeInnerRadius = cms.double(0.04), EcalRecHitInnerRadius = cms.double(0.06), EcalRecHitOuterRadius = cms.double(0.4), EcalRecHitEtaSlice = cms.double(0.04), EcalRecThresh = cms.double(0.0), HcalRecHitInnerRadius = cms.double(0.1), HcalRecHitOuterRadius = cms.double(0.4), HcalRecHitEtaSlice = cms.double(0.), HcalRecHitThresh = cms.double(0.0),
Results for fake g’s • ET distribution of the grec from dijet QCD • Original (ET>20GeV, H/E<0.2, |h|<1.45) • After track cut (# Tracks≤2) • After Track&Fisher cut(FisherResp>0.05) • Only PhotonID cuts • Fisher Cut reducesQCD most in lowest ET bins • Similar result for barrel [slide 32] Scaled to 200pb-1 -grec(Original) -grec (# Trk ≤2) -grec (Pass Fisher) -grec (Photon ID)
Results for g’s • ET distribution of the grec from g+jet • Original (ET>20GeV, H/E<0.2, |h|<1.45) • After track cut (# Tracks≤2) • After Track&Fisher cut(FisherResp>0.05) • Only PhotonID cuts • First three overlap on graph • Most losses in lowest ET bins • Similar result for barrel [slide 33] Scaled to 200pb-1 -grec(Original) -grec (# Trk ≤2) -grec (Pass Fisher) -grec (Photon ID)