Understanding Water Quality Metrics and Indices for Ecosystem Management
This document outlines key concepts in water quality assessment, including parameters, indicators, and metrics critical to understanding ecosystem health. It discusses the definition and examples of biological, physical, and chemical metrics, along with the significance of indices like the Water Quality Index (WQI) and the Carlson Trophic State Index (TSI). The document highlights the use of multimetric indices to synthesize diverse data into understandable formats for effective management and communication. It emphasizes the importance of indices in evaluating water quality trends and potential impacts on aquatic life.

Understanding Water Quality Metrics and Indices for Ecosystem Management
E N D
Presentation Transcript
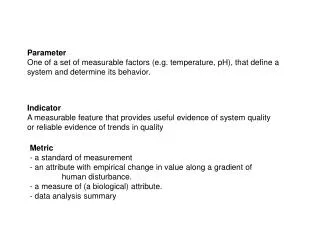
Parameter One of a set of measurable factors (e.g. temperature, pH), that define a system and determine its behavior. Indicator A measurable feature that provides useful evidence of system quality or reliable evidence of trends in quality Metric - a standard of measurement - an attribute with empirical change in value along a gradient of human disturbance. - a measure of (a biological) attribute. - data analysis summary
Types, examples of metrics Biological EPT % Sensitive Diatoms plant/animal condition Physical (river) channel length, sinuosity (land use type) area, density Chemical pH Temperature DO PPM DO %Sat etc.
Index an aggregated number used to judge condition (e.g. IBI, RBP) A water quality index is a means to summarize large amounts of water quality data into simple terms (e.g., good, fair, poor) for reporting to management and the public in a consistent manner.
Indices Can tell whether overall WQ poses threat to uses - e.g. habitat for aquatic life irrigation water for agriculture and livestock recreation and aesthetics drinking water supplies.
Multimetric Indices (EPA, Bio example) numbers that integrate several biological metrics to indicate a site’s condition. designed to be sensitive to a range of factors (physical, chemical, and biological) that stress biological systems, are relatively easy to measure and interpret.
Indices - Multimetric approach each metric is given a rating according to whether its value approximates, deviatessomewhatfrom, or deviates stronglyfrom values measured in least-disturbed ecosystems of a particular type within a region. These ratings (e.g., excellent, moderate, fair, and poor) can be used to make decisions about whether the water body condition indicates that aquatic life is being supported.
Advantages of an index include ability to represent a variety of variables in a single number, ability to combine various measurements in a variety of different measurement units in a single metric effectiveness as a communication tool. can be used to convey relative differences in water quality between sites (or @ one site) over time
Air Quality Index Good: simple number and color easy to remember succinct underlying explanation pertaining to issue important to audience (public health).
AQI Caveats: • How AQI Calculated: • monitors record concentrations of major pollutants at many locations • ground-level ozone • particle pollution • carbon monoxide • sulfur dioxide • nitrogen dioxide • formula used to convert raw values into numeric scale. • Highest – rated pollutant becomes AQI for that day. • E.g. ozone = 90, Sulfur dioxide = 88; AQI = 90. • Problems. If: • Sensitivity to one type of pollution. • OR: need to know where pollution types are coming from. • AQI alone not helpful. Underlying information useful
Indices - Good general rule When presenting indices, The overall “score” is valuable but make supporting detailed information accessible. AQI Presentation tip: Print score/color on web site home page, familiar icon/box (like weather info) Clickable links to more detailed table, information.
Carlson’s Trophic State Index Trophic State Indices (TSIs) are an attempt to provide a single quantitative index for the purpose of classifying and ranking lakes, from standpoint of nutrient influence on water quality . Carlson TSI commonly used by Volunteer Monitors
Carlson TSI assumption: major assumption is that suspended particulate material in the water controls Secchi depth and that algal biomass is the major source of particulates;Increased nutrients (phosphorus): Produce increased algal biomass (chlorophyll a) Produce decreased water clarity (Secchi disk) Carlson TSI quantifies this relationship. Ranges along a scale from 0-100.
Carlson TSI useful for comparing lakes within a region assessing changes in trophic status over time. Higher values correspond to increased trophic state. An increase in TSI of 10 units corresponds to a halving of Secchi depth and a doubling of phosphorus concentration.
Carlson TSI Formulae: TSI = 60 - 14.41 Ln Secchi disk (meters) TSI = 9.81 Ln Chlorophyll a (ug/L) + 30.6 TSI = 14.42 Ln Total phosphorus (ug/L) + 4.15 Because these are interrelated by linear regression models, any one of the variables can be used to derive a TSI score.
Carlson TSI Caveats: Chlorophyll best for classification: most accurate at predicting algal biomass. Carlson states total phosphorus may be better than chlorophyll at predicting summer trophic state from winter samples Transparency should only be used if there are no better methods available. Use Carlson TSI with lakes with few rooted aquatic plants and little non-algal turbidity. Not appropriate for other lakes.
River Network Macroinvertebrate metrics, index From Living Waters Manual http://www2.rivernetwork.org/index.cfm Two levels of sampling, analysis. Level 1: Order. 6 metrics Level 2: Family 10 metrics. Level 2 uses 7 of the metrics to calculate Overall Percent Similarity Index (to reference)
Steps to calculate River Network % Similarity Index: Step 1: Calculate each metric for reference and for target collection. (Instructions in Living Waters manual) Step 2. Convert each metric score to % similarity (*use Dominance, CSI directly) Example
River Network Macroinvertebrate Index Step 5. Divide Total Score: Target population / Reference 18 / 42 = 43% similarity between target and reference collections. Step 6. Categorize results > 79%: Non-impaired. 29-72%: Moderately impaired < 21% Severely impaired Observations/caveats: Use with different sites within similar geographic area, stream order, etc. Information in each metric may provide additional insight, depth to overall index: i.e. aid in data interpretation.
Selecting/Creating metrics and indices Multimetric Indices to Prepare and Analyze Data http://www.epa.gov/bioindicators/html/multimetric.html Five activities are central to making multimetric biological indexes effective: Classifying environments to define homogeneous sets within or across ecoregions (e.g., streams, lakes, or wetlands; large or small streams; warm-water or cold-water lakes; high- or low-gradient streams). Selecting measurable attributes that provide reliable and relevant signals about the biological effects of human activities. Developing sampling protocols and designs that ensure that those biological attributes are measured accurately and precisely. Devising analytical procedures to extract and understand relevant patterns in those data. Communicating the results to citizens and policymakers so that all concerned communities can contribute to environmental policy.
Selecting/Creating metrics and indices Good Metrics: Sensitive to change Predictable, consistent Metrics vary in their scale--they can be: integers percentages dimensionless numbers qualitative observations (e.g. grassland vs. forest). Translation into unitless scores must address this. Standardization assumes that each metric has the same value and importance (i.e., they are weighted the same), and that a 50% change in one metric is of equal value to assessment as a 50% change in another.
Most IBIs contain between 8 and 12 metrics. Metrics must be tested to ensure their precision and accuracy. (see discussion in Wisconsin DNR “Development of a Wetlands Biological Index…” report) Metrics to Indices: Attributes to consider: Scope - How many? - The number of water quality variables that do not meet objectives, relative to the total number of variables measured. Frequency – How often? - The number of individual measurements that do not meet objectives, relative to the total number of measurements made. Amplitude – How much? – The amount by which measurements depart from those objectives.
Presenting Indices • General tips: • Know your target audience • Expertise level • Particular interest • Use objective • Personal: resource use • Education • Resource management/regulation • Where to target resources • Impaired waters designation • TMDL development • Etc.
Make your own indices. Examples. Trout comfort zone (Combine DO, temperature, volume of lake containing suitable values. … add duration/frequency of excursions? Boating recreation index (Number of days when water levels, water quality, weather, etc. (absence of duckweed on lake surface, open channels) combine for “pleasant” boating experiences… add economic impact?) Fishing recreation index. (Similar to boating - # of days when water levels, bug hatches, etc. afford quality fishing) Beach closure days (see fishing, boating above… for added economic impact, consider extra weight for scores on holiday / high traffic periods). Water clarity / home value index (Combine Secchi disk data with real estate prices).
Haikus as water quality indices? Shattering the stillness Of an ancient pond A frog jumps into water - - Basho