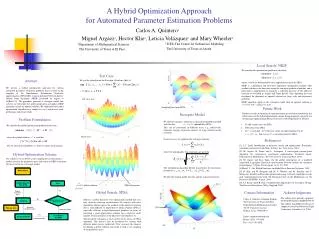
Comprehensive Parameter Optimization Analysis Support Tools
Utilize advanced statistical and graphical analyses combined with state-of-the-art tools like Rosenbrock Optimization and Troutman Sensitivity Analysis. Explore Beta Testing and Shuffle Evolution Optimization for multi-objective Generalized Sensitivity Analysis. Implement strategies for parameter estimation and calibration to refine models efficiently. Overcome challenges with distributed parameter fitting and model calibration limitations. Leverage Multi-Objective Complex Evolution Algorithm and explore Pareto Optimality for optimal solutions.

Comprehensive Parameter Optimization Analysis Support Tools
E N D
Presentation Transcript
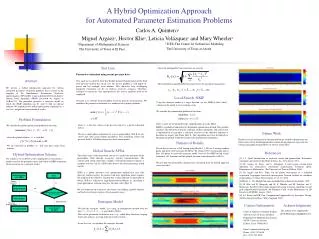
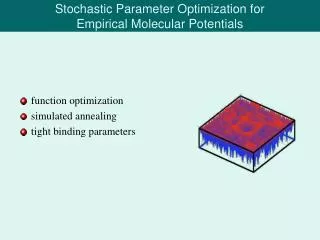
ANALYSIS and SUPPORT TOOLS Currently Available Statistical and Graphical Analyses Rosenbrock Optimization Troutman Sensitivity Analysis Beta Testing Shuffle Complex Evolution Optimization Multi-Objective Generalized Sensitivity Analysis (MOGSA) Multi-Objective COMplex Evolution Algorithm (MOCOM) Generalized Likelihood Uncertainty Estimation (GLUE)
PARAMETER ESTIMATION (CALIBRATION) STRATEGY LEVELS • Estimate all parameters from digital databases (GIS Weasel) and other regional relations • Adjust ET parameter to match potential ET for area or region • Apply XYZ method for precipitation and temperature distribution • Calibrate parameters for hydrograph timing • Calibrate all sensitive parameters
Optimization:Distributed Parameter Fitting • Assume parameter values are spatially correct • assume relative magnitudes of parameter values are correct • Can fit all values of one parameter or subsets of a parameter • All values of set or subset are moved in the same direction at the same time • Values are moved either by the same fixed increment or as a percentage of their magnitude
MODEL CALIBRATION LIMITATIONS • Ungauged basins (streamflow, meteorological data) • Land-use change • Climate change • Over-parameterization • Parameter equifinality
å | Oi - Pi | i å ( Oi - Pi )2 i å | ln(Oi + 1)- ln( Pi+ 1) | i å ( ln(Oi + 1)- ln( Pi+ 1))2 i Objective Functions Rosenbrock Optimization
Pareto Solutions Pareto Optimality
Y1obs Y1(θ) - - X1 F1(θ) + + M(θ) X2 F2(θ) X3 Y2(θ) Y2obs F1(θ) θ1 Pareto Solutions θ2 F2(θ) Multi-Criteria Optimization
Automatic Multicriteria Approach • Identify several characteristic features each representing unique behavior of the watershed. • Develop objective measures of the “closeness” of the model output to these features. • Simultaneously minimize all of these measures with an optimization routine (MOCOM-UA).
Developing Objective Measures peaks/timing quick recession baseflow
Testing of Automatic Multicriteria Approach with SAC-SMA model Leaf River Watershed (1950 km2) 11 years daily calibration data
å | Oi - Pi | i å ( Oi - Pi )2 i å | ln(Oi + 1)- ln( Pi+ 1) | i å ( ln(Oi + 1)- ln( Pi+ 1))2 i Objective Functions (measures of performance)
PRMS Sensitivity Analysis • Sensitivity Matrix (relative sensitivity) • Information Matrix • Error Propagation Table • (5, 10, 20, 50% change in parameter value) • Joint & Individual Standard Errors in Parameters • (measure of confidence) • Correlation Matrix • Hat Matrix • (diagonal elements are measure of influence a day is having on optimization, range 0-1)
SR = (QPRED / PI)*(PI / QPRED) ¶ ¶ Relative Sensitivity
Generalized Likelihood Uncertainty Estimation -- GLUE a methodology based on Monte Carlo simulation for estimating the predictive uncertainty associated with models
Solar Radiation Transmission Coefficient (rad_trncf) vs Cover Density
Rockies Sierras Cascades Parameter Equifinality (inches) Uncalibrated Estimate (deg F)
Weasel Value Parameter Sensitivity and Weasel Determined Value Animas River (Rockies) Objective Function rad_trncf soil_moist_max
Weasel Value Parameter Sensitivity and Weasel Determined Value EF Carson River (Sierras) Objective Function rad_trncf soil_moist_max
Weasel Value Parameter Sensitivity and Weasel Determined Value CleElum River (Cascades) Objective Function rad_trncf soil_moist_max
Developing Objective Measures peaks/timing quick recession baseflow