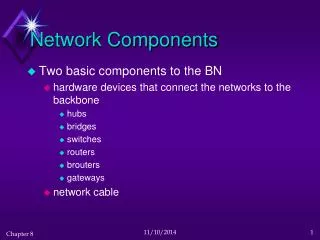
Monitoring network performance has two components
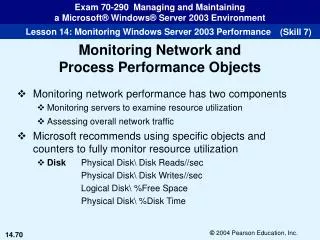
(Skill 7). Monitoring Network and Process Performance Objects. Monitoring network performance has two components Monitoring servers to examine resource utilization Assessing overall network traffic Microsoft recommends using specific objects and counters to fully monitor resource utilization

Monitoring network performance has two components
E N D
Presentation Transcript
(Skill 7) Monitoring Network and Process Performance Objects • Monitoring network performance has two components • Monitoring servers to examine resource utilization • Assessing overall network traffic • Microsoft recommends using specific objects and counters to fully monitor resource utilization • Disk Physical Disk\ Disk Reads//sec Physical Disk\ Disk Writes//sec Logical Disk\ %Free Space Physical Disk\ %Disk Time
(Skill 7) Monitoring Network and Process Performance Objects (2) • Memory: \Available Bytes \Cache Bytes \Pages/sec \Page Reads/sec \Transition Faults/sec \Pool Paged Bytes \Pool Nonpaged Bytes Paging File \%Usage object (all instances) Cache \Data Map Hits % Server \Pool Paged Bytes Server \Pool Nonpaged Bytes
(Skill 7) Monitoring Network and Process Performance Objects (3) • To monitor memory usage, watch the Memory\Available Bytes and Memory\Cache Bytes counters • Use the other Memory object counters to monitor for memory bottlenecks
(Skill 7) Monitoring Network and Process Performance Objects (4) • Processor: Processor\%Processor Time (all instances) System\Processor Queue Length (all instances) Processor\Interrupts/sec System\Context switches/sec • Use the Processor \%Processor Time counter to monitor processor usage • Use the other three counters to monitor for processor bottlenecks
(Skill 7) Monitoring Network and Process Performance Objects (5) • To monitor for bottlenecked network resources, you can observe the Network Interface - Bytes Total/sec, Bytes Sent/sec, and Bytes Received/sec counters for each network interface adapter (NIC) • The Bytes Received/sec counter measures the rate at which bytes are received from each NIC over a TCP/IP connection • The Bytes Sent/sec counter measures the rate at which bytes are sent over each NIC
(Skill 7) Report View Figure 14-51 Monitoring Server Resource Utilization
(Skill 7) Monitoring Network and Process Performance Objects (6) • To get a general picture of how busy the server is, use the Server—Bytes Total/sec, Bytes Received/sec, and Bytes Transmitted/sec counters • If the sum of the Server—Bytes Total/sec counter for all network servers is approaching the maximum transfer rates (i.e.,10 MB/sec or 100 MB/sec), you may need to segment the network
(Skill 7) Report View Figure 14-52 Finding Network Bottlenecks
(Skill 8) Tracking Windows Server 2003 Activities with Audit Policy • Each time a user logs on to a computer or to a network, he or she performs a number of activities called events • Events include accessing files, folders, printers, and the Registry as well as the logon process • As a network administrator, you will want to track and monitor some of these events on a regular basis to ensure the security and seamless functioning of the computers on the network
(Skill 8) Tracking Windows Server 2003 Activities with Audit Policy (2) • Auditing is used to track user activities and object access on the computers on a network • To audit who is accessing objects and the actions they perform, you must first activate the audit object access policy • Configure the audit object access policy in the Properties dialog box and System ACL (SACL) editor for an object • A SACL is used to allow the system administrator to log any attempts to gain access to an object • The list of ACEs (access control entries) in the SACL will determine the users and groups to be audited
(Skill 8) Tracking Windows Server 2003 Activities with Audit Policy (3) • Discretionary ACL (DACL) is used to set permissions • DACL determines which users and groups can and cannot access the object • DACL is controlled by the owner of the object or anyone who has been granted the right to change permissions for the object • You can audit local users or local groups, and if the computer is in a domain, domain users, and domain groups • After you select who you are going to audit, you must choose the file system actions to monitor in the SACL editor for the file or folder
(Skill 8) Tracking Windows Server 2003 Activities with Audit Policy (4) • Auditing is used to help prevent security breaches by allowing you to track unauthorized attempts to log on or access folders • Auditing is also used to help conduct resource planning for the computers on your network
(Skill 8) If you change audit policy in the Default Domain Policy GPO, which links to the root of the domain, the same audit policy will be applied to every computer in the domain unless a higher priority GPO or a GPO linked to a lower OU has a conflicting audit policy The audit policies that can be configured on all computers Figure 14-53 Modifying the default domain audit policy
(Skill 8) Figure 14-54 Tracking failed logon attempts
(Skill 8) Figure 14-55 Tracking both successful and failed object access
(Skill 8) Click to open the Select User, Computer, or Group dialog box where you can choose who or what to audit Figure 14-56 Advanced Security Settings for Annual Reports dialog box
(Skill 8) Click to reopen the Select User, Computer, or Group dialog box to change who or what is being audited Select to apply the access control settings only to objects within the Annual Reports folder Figure 14-57 Selecting the actions to be audited
(Skill 8) In the Computer Management console, you can view the audit entries in the Security log on a remote computer if you have administrative privileges Figure 14-58 Connecting to a remote computer
(Skill 8) Figure 14-59 The Select Computer dialog box
(Skill 9) Viewing the Security Log • Auditing increases the overhead on a computer, so you must carefully choose the events you think are important to monitor • Identify the events to monitor • Determine for whom you want to monitor them • Identify the actions to track • Once you have carefully planned the events to monitor, you must set a schedule to check the Security log regularly • You can also maintain the Security log by specifying a maximum file size
(Skill 9) Viewing the Security Log (2) • Options for managing the size of the Security log • Overwrite old events as needed • Set a specific age for the events you want to be overwritten • Prevent events from being overwritten • If you choose to overwrite old events, you could lose data if the log becomes full before you archive it • If you choose the second option, you could lose data that is at least as many days old as specified if you do not archive the log soon enough • If you choose the final option, you must monitor the Security log often enough to archive or clear it before it becomes full; when the log is full, the operating system will stop recording events
(Skill 9) Figure 14-61 The Filter tab in the Security Properties dialog box Figure 14-60 The Security (log) Properties dialog box
(Skill 9) Figure 14-62 The Security log
(Skill 9) Figure 14-63 Filtering the Security log Figure 14-64 Viewing event details
(Skill 10) Working with the Network Monitor • In addition to the System Monitor, the other tools you can use to monitor the network include the Network Monitor Driver, Network Monitor, and SNMP service • Network Monitor Driver • Works in conjunction with Network Monitor to make it possible for you to analyze frames (data packets) sent by and received from a NIC • You can use it to obtain network performance statistics that are used by System Monitor and Network Monitor to troubleshoot networking problems and monitor for specific network events
(Skill 10) Working with the Network Monitor (2) • Network Monitor Driver protocol • Is used to collect statistics about the activity detected by the network card • These statistics are reported to, and can be viewed on a Windows Server 2003 computer that is running the Network Monitor Agent Service or Systems Management Server • After the Network Monitor Driver is installed, you can monitor the number of packets sent and received by a computer • The NIC gathers information about broadcasts, unicasts, and multicasts, as well as data regarding protocol traffic and network activity
(Skill 10) Figure 14-65 Broadcast, multicast, and unicast
(Skill 10) Figure 14-66 The Select Network Component Type dialog box
(Skill 10) Figure 14-67 Installing the Network Monitor Driver protocol
(Skill 10) Figure 14-68 Installing Network Monitor and SNMP
(Skill 10) Figure 14-69 The Microsoft Network Monitor message box Select the connection that you want to monitor Figure 14-70 The Select a network dialog box
(Skill 10) Toggle Graph Pane The toggle buttons toggle the pane either open or closed. All panes are open by default Toggle Total Statistics Pane Toggle Session Statistics Toggle Station Statistics Figure 14-71 The Capture window in Network Monitor Click to view only the selected pane
(Skill 10) Graph pane Total statistics pane Session Statistics pane Click to pause data capture Station Statistics pane Figure 14-72 Viewing network statistics
(Skill 10) Displays the address of the device in the sending (source) computer Displays the address of the device in the receiving (destination) computer Displays the transmission protocol Figure 14-73 A Capture summary
(Skill 11) Introducing Simple Network Management Protocol (SNMP) Services • SNMP (Simple Network Management Protocol), which is part of the TCP/IP protocol suite, is used to configure network devices and computers to compile network performance data • When you install the SNMP service on a computer, your computer becomes an SNMP agent that can communicate with an SNMP network management station (NMS)
(Skill 11) Introducing Simple Network Management Protocol (SNMP) Services (2) • Components of the SNMP service • Network management station (NMS) • SNMP agent • Management information base (MIB) • The NMS and the SNMP agents belong to an SNMP community, which is a collection of computers grouped for administrative and security purposes
(Skill 11) Introducing Simple Network Management Protocol (SNMP) Services (3) • Defining communities is a security feature, similar to creating a password • The best method of enforcing SNMP security on a network (using the SNMP 2.0 specification) is to define NMS IP addresses • This prevents agents from responding to a rogue NMS, since its IP is not in the allowed list
(Skill 11) Figure 14-74 The SNMP Service Properties dialog box
(Skill 11) The five permission levels you can assign to an SNMP community are None, Notify, Read Only, Read Write, and Read Create Figure 14-75 SNMP Service Configuration dialog box Enter a host name, IP, or IPX address to configure the SNMP service to accept data packets only from a particular host Figure 14-76 Configuring SNMP security
(Skill 11) When you set up a network monitoring station you will create communities Figure 14-77 Security tab—SNMP Service Properties dialog box
(Skill 11) If you set up an NMS and you configure traps, you must enter a Community name and a Trap destination (IP or IPX address or host name) to which the traps will be forwarded Figure 14-78 The Traps tab – SNMP Service Properties dialog box
(Skill 11) Introducing Simple Network Management Protocol (SNMP) Services (4) • Problems that may occur after configuring the SNMP service • The SNMP service does not function properly • The SNMP time-out period is not adequate for communicating with the WINS server • An Error 3 occurs when an IPX address is entered as a trap destination and the computer is restarted
(Skill 11) Figure 14-79 SNMP Group Policy