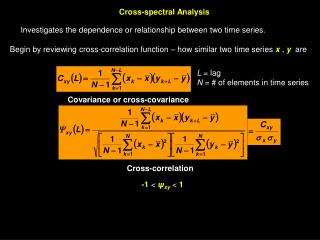
Download
1 / 11
110 likes | 273 Views
MSE Spectral Analysis on the Madison Symmetric Torus. Betsy Den Hartog Jinseok Ko Kyle Caspary Daniel Den Hartog Darren Craig. MST RFP is a toroidally axisymmetric current carrying plasma with B f ~ B q , 0.2 ≤ |B| ≤ 0.5 T.

E N D
MSE Spectral Analysis on the Madison Symmetric Torus Betsy Den Hartog Jinseok Ko Kyle Caspary Daniel Den Hartog Darren Craig
MST RFP is a toroidally axisymmetric current carrying plasma with Bf ~ Bq , 0.2 ≤ |B| ≤ 0.5 T Self-generated currents drive plasma to a relaxed state in which toroidal field is reversed at edge
Motional Stark Effect Overview • H beam atoms experience an electric field: E = vbeamxB • Ha emission stark splitting • Linear at high fields • Obtain B┴ from line splitting • p components linearly polarized along E • s components circularly polarized n=3 n=2 Dl = lo2(3/2)(eao/hc)|E| p+ s p-
MSE implementation on MST Diagnostic Neutral Beam E = 46 keV I = 5.5 A Divergence = 18 mrad Duration = 20 ms • On-Axis Views • 7 views • all looking at magnetic center • shuttered to look at different time points • Mid-Radius views • 4 views • 2 orthogonal polarizations • 2 time points
On-Axis Analysis • Low Fields of MST Present Challenge - E~ 1 MV/m • Stark components not resolved • use polarizer to block most of s and pass p radiation • Data is fit to the sum of 9 gaussians based on linear Stark model – relative I’s taken from Mandl Note p+/p- asymmetry. This is typical of MST MSE data. p+ p-
Analysis considerations • Linear Stark model not adequate at low fields • Need a model which includes Zeeman and spin-orbit terms (ADAS 605) • Cannot account for p+/p- asymmetry, non-equilibrium populations?
On-axis spectral fitting Old fit B = 0.41 T New fit B = 0.39 T 400 kA plasma B = 0.27 T B = 0.26 T 200 kA plasma
Mid-radius view – a challenge! • Two orthogonal polarizers • Now getting usable data showing broadening on one polarizer view • Geometry constraints limit ‘contrast’ between 2 views
Mid-radius view • p and s radiation patterns mapped onto the plane of the polarizer • mid-radius patterns depend on pitch angle • s ellipse lies oriented in same direction as linear p – limiting ‘contrast’ pi
Mid-radius view – first cut fit |B| and pitch angle now both free parameters in fit pi |B| = 0.42 ± 0.07 T g = 40.3° ± 9.4°
Summary • Incremental improvement in on-axis analysis utilizing ADAS 605 • Still have not explained p+/p- asymmetry - ADAS development underway may yield insight • Mid-radius view promising to yield |B| and g