Spectral Analysis
Spectral Analysis. Spectral analysis is concerned with the determination of the energy or power spectrum of a continuous-time signal


Spectral Analysis
E N D
Presentation Transcript
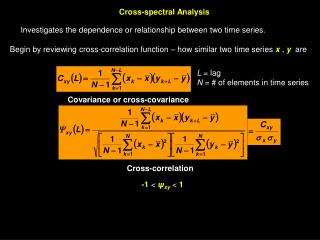
Spectral Analysis • Spectral analysis is concerned with the determination of the energy or power spectrum of a continuous-time signal • It is assumed that is sufficiently bandlimited so that its spectral characteristics are reasonably estimated from those of its of its discrete-time equivalent g[n] 1
Spectral Analysis • To ensure bandlimited nature is initially filtered using an analogue anti-aliasing filter the output of which is sampled to provideg[n] • Assumptions: (1)Effect of aliasing can be ignored (2)A/D conversion noise can be neglected 2
Spectral Analysis • Three typical areas of spectral analysis are: • 1) Spectral analysis of stationary sinusoidal signals • 2) Spectral analysis of of nonstationary signals • 3) Spectral analysis of random signals 3
Spectral Analysis of Sinusoidal Signals • Assumption - Parameters characterising sinusoidal signals, such as amplitude, frequency, and phase, do not change with time • For such a signal g[n], the Fourier analysis can be carried out by computing the DTFT 4
Spectral Analysis of Sinusoidal Signals • Initially the infinite-length sequence g[n] is windowed by a length-N window w[n] to yield • DTFT of then is assumed to provide a reasonable estimate of • is evaluated at a set of R( ) discrete angular frequencies using an R-point FFT 5
Spectral Analysis of Sinusoidal Signals Note that • The normalised discrete-time angular frequency corresponding to DFT bin k is • while the equivalent continuous-time angular frequency is 6
Spectral Analysis of Sinusoidal Signals • Consider • expressed as • Its DTFT is given by 7
Spectral Analysis of Sinusoidal Signals • is a periodic function of w with a period 2p containing two impulses in each period • In the range , there is an impulse at of complex amplitude and an impulse at of complex amplitude • To analyse g[n] using DFT, we employ a finite-length version of the sequence given by 8
Spectral Analysis of Sinusoidal Signals • Example - Determine the 32-point DFT of a length-32 sequence g[n] obtained by sampling at a rate of 64 Hz a sinusoidal signal of frequency 10 Hz • Since Hz the DFT bins will be located in Hz at ( k/NT)=2k, k=0,1,2,..,63 • One of these points is at given signal frwquency of 10Hz 9
Spectral Analysis of Sinusoidal Signals • DFT magnitude plot 10
Spectral Analysis of Sinusoidal Signals • Example - Determine the 32-point DFT of a length-32 sequence g[n] obtained by sampling at a rate of 64 Hz a sinusoid of frequency 11 Hz • Since the impulse atf = 11Hz of the DTFT appear between the DFT bin locationsk = 5andk = 6 • the impulse at f= -11Hz appears between the DFT bin locations k = 26 andk = 27 11
Spectral Analysis of Sinusoidal Signals • DFT magnitude plot • Note: Spectrum contains frequency components at all bins, with two strong components atk = 5andk = 6, and twostrong components atk = 26andk = 27 12
Spectral Analysis of Sinusoidal Signals • The phenomenon of the spread of energy from a single frequency to many DFT frequency locations is called leakage • Problem gets more complicated if the signal contains more than one sinusoid 13
Spectral Analysis of Sinusoidal Signals • Example • - • From plot it is difficult to determine if there is one or more sinusoids in x[n] and the exact locations of the sinusoids 14
Spectral Analysis of Sinusoidal Signals • An increase in resolution and accuracy of the peak locations is obtained by increasing DFT length to R = 128 with peaks occurring at k = 27 and k =45 15
Spectral Analysis of Sinusoidal Signals • Reduced resolution occurs when the difference between the two frequencies becomes less than 0.4 • As the difference between the two frequencies gets smaller, the main lobes of the individual DTFTs get closer and eventually overlap 16
Spectral Analysis of Nonstationary Signals • An example of a time-varying signal is the chirp signal and shown belowfor • The instantaneous frequency ofx[n] is 17
Spectral Analysis of Nonstationary Signals • Other examples of such nonstationary signals are speech, radar and sonar signals • DFT of the complete signal will provide misleading results • A practical approach would be to segment the signal into a set of subsequences of short length with each subsequence centered at uniform intervals of time and compute DFTs of each subsequence 18
Spectral Analysis of Nonstationary Signals • The frequency-domain description of the long sequence is then given by a set of short-length DFTs, i.e. a time-dependent DFT • To represent a nonstationary x[n] in terms of a set of short-length subsequences, x[n] is multiplied by a window w[n] that is stationary with respect to time and move x[n] through the window 19
Spectral Analysis of Nonstationary Signals • Four segments of the chirp signal as seen through a stationary length-200 rectangular window 20
Short-Time Fourier Transform • Short-time Fourier transform (STFT), also known as time-dependent Fouriertransform of a signal x[n] is defined by where w[n] is a suitably chosen window sequence • If w[n] = 1, definition of STFT reduces to that of DTFT ofx[n] 21
Short-Time Fourier Transform • is a function of 2 variables: integer time index n and continuous frequency w • is a periodic function of wwith a period 2p • Display of is the spectrogram • Display of spectrogram requires normally three dimensions 22
Short-Time Fourier Transform • Often, STFT magnitude is plotted in two dimensions with the magnitude represented by the intensity of the plot • Plot of STFT magnitude of chirp sequence with for a length of 20,000 samples computed using a Hamming window of length 200 shown next 23
Short-Time Fourier Transform • STFT for a given value of n is essentially the DFT of a segment of an almost sinusoidal sequence 24
Short-Time Fourier Transform • Shape of the DFT of such a sequence is similar to that shown below • Large nonzero-valued DFT samples around the frequency of the sinusoid • Smaller nonzero-valued DFT samples at other frequency points 25
STFT on Speech • An example of a narrowband spectrogram of a segment of speech signal 26
STFT on Speech • The wideband spectrogram of the speech signal is shown below • The frequency and time resolution tradeoff between the two spectrograms can be seen 27