Download
1 / 15
150 likes | 449 Views
Warm-up 10.2 Chi-Square Test of Homogeneity. The professor of a large survey class is instructed to give final grades in the proportions: 10 % A, 20% B, 40% C, 20% D and 10 % F. One semester she gives 22 As, 27 Bs, 49 Cs, 35 Ds, and 17 Fs in a class of 150.

E N D
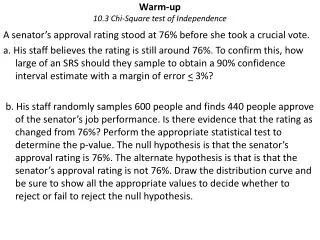
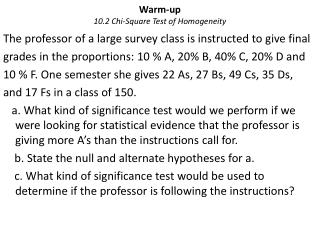
Warm-up10.2 Chi-Square Test of Homogeneity The professor of a large survey class is instructed to give final grades in the proportions: 10 % A, 20% B, 40% C, 20% D and 10 % F. One semester she gives 22 As, 27 Bs, 49 Cs, 35 Ds, and 17 Fs in a class of 150. a. What kind of significance test would we perform if we were looking for statistical evidence that the professor is giving more A’s than the instructions call for. b. State the null and alternate hypotheses for a. c. What kind of significance test would be used to determine if the professor is following the instructions?
Answers to H.W. Problem D #12,13 and E #4 D#12. In a z-test a mean is being compared to a hypothesized proportion. For a chi-square test a set of values are being compared to another set of expected values for a number of categorical data. #13 If the test is only to compare the hypothesized 50% that eat their lunch off campus to the sampled proportion, then a one-proportion z-test should be completed.
10.2 χ2Test of Homogeneity Many colleges survey graduating classes to determine the plans of the graduates. A specific college gets the results and questions how the numbers compare for the different colleges.
Almost the same as χ2 Goodness-of-fit test Question: Are the results different for all four colleges? Step 1: Discuss conditions and describe test. Randomization Counted Data Expected Cell Frequency The conditions seem to be met, so I can use a χ2 model with (3 - 1) x (4 – 1) = 6 degrees of freedom and do a chi-square test of homogeneity.
Calculating Expected Step 2 : Write the hypotheses Show the table for Observed/Expected Ho: HA:
Steps 3 Step 3 : Calculate Chi-Squared and P-value. Draw the curve.
Step 4 Step 4: Write a conclusion with a decision and restate the p-value in context.
Another Example The table shows the number of Central High School students who passed the A.P. Calculus AB Exam. Question: Has there been a change in the distribution of passing grades on Calculus AB exam over these three years? Total 44 36 39 119 % with a 5 % with a 4 % with a 3 Total 43 41 35
Step 1 Step 1: Discuss conditions and describe test. Randomization Counted Data Expected Cell Frequency The conditions _____________, so I can use a χ2 model with _______________ degrees of freedom and do a chi-square test of homogeneity.
Step 2 Calculate the Expected State the hypotheses
Step 3 Calculate the Chi-Square and the P-value. Draw the curve. Step 4 Calculate the conclusion. H.W. Read 10.2 and complete E#17 Use numbers and not % and for part a. Do make the table of frequencies but don’t make a segmented bar graph.
Tests from 8.1, 8.2, 9.1 and 9.2 • Some of the mult. choice were more difficult than intended so I gave every one 4 pts back which is worth one point. It was out of 25 pts. • When calculating the confidence interval for the mean it the critical value is the t* not z* so a 95% confidence interval is not 1.96 for t* because it also depends on the degrees of freedom ( n – 1). You had to use the T-interval Test on your calculator.