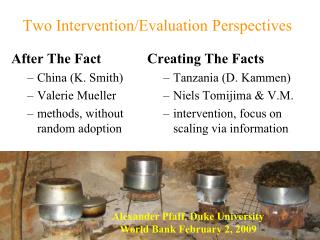
Two Intervention/Evaluation Perspectives
Two Intervention/Evaluation Perspectives. Creating The Facts Tanzania (D. Kammen ) Niels Tomijima & V.M. intervention, focus on scaling via information. After The Fact China (K. Smith) Valerie Mueller methods, without random adoption. Alexander Pfaff, Duke University

Two Intervention/Evaluation Perspectives
E N D
Presentation Transcript
Two Intervention/Evaluation Perspectives Creating The Facts • Tanzania (D. Kammen) • NielsTomijima & V.M. • intervention, focus on scaling via information After The Fact • China (K. Smith) • Valerie Mueller • methods, without random adoption Alexander Pfaff, Duke University World Bank February 2, 2009 RAEL
Who Adopts Matters Evaluating Health Impacts of Improved Stoves in China using Matching Methods Valerie Mueller (IFPRI), Alexander Pfaff (co-lead authors) John Peabody, Yaping Liu, Travis Riddell, Kirk R. Smith
Motivation Known potential for confounding due to choice, with stoves occupying a sort of middle ground: • groundwater arsenic levels are exogenous • stove adoption is not but one can randomize (critical questions of where in the process) • conservation policies (PAs or eco-payments) not randomized yet, so deal with in the data Evaluation / example that this matters for policy. 1
Why worry? Many a slip twixt stove & .. Often studies measure Exposure = Use Stove X and thus Exposure Changes = Stoves Changes: Reduced risks assoc. with improved biomass stoves (Ezzati and Kammen, 2002 & Smith et al., 2004) Outcomes include respiratory symptoms, blood pressure, acute respiratory infection, middle ear infection, COPD, lung and other cancers, asthma, tuberculosis, low birth weight, eye diseases Numerous China studies focus on lung cancer rates • link aggregate data on lung cancer rates and percentages of coal usage (Mumford et al. 1987, 1989; Lan et al. 2002) • Peabody et al. (2005) find stoves reduce respiratory disease, COPD, exhaled CO, and increase FVC in comparison to TB. 2
With exposure data, two steps seems easier: dose-response function analyzes health given exposure However, Tomijima’s ongoing literature review finds little exposure measurement (Modi/Jack presentation today): Ezzati and Kammen 2000 & 2001 Kirk Smith’s stove randomization project (w/in Guatemala) measures some exposures (Paris 2006 talk not published) (2) stove impacts then could focus just on lower exposure - FEWER factors affect exposure given the stove used - BUT NOT NONE {even if randomize distribution !!} - ventilation of one’s home (SusmitaDasgupta) - location of people vs. stove (KammenEzzati) 2
What drives stove adoption in China study? Household-level variation (e.g. all health relevant above), noting that households bore over 90% of direct costs County-level variation, in conditions and county actions National Improved Stove Program (Sinton et al. 2004) Phase 1 (early 1980s-1992) • counties applied to participate and selection depended on energy shortages, dependence, and local willingness to share the cost burden • stoves were subsidized, but households paid for materials and installation Phase 2(1990-1995) • no household subsidies, instead energy industries given tax and loan benefits. • MOH started program to improve kitchens in poor regions targeting fluorosis Phase 3 (after 1995) • after 1998 Yangtze River flood , project to i) reduce soil erosion by supporting reforestation and ii) promote improved stoves to reduce fuelwood demand • promotion of rural coal markets to convert previous biomass users to coal use 2
Our Analysis Focuses on comparing households within relevant counties. Breaks out multiple treatments given four stove/fuel options: - ‘cleaner’ stoves are Clean and Improved Biomass - ‘dirtier’ stoves are Traditional Biomass and Coal - for each pairing/comparison, drop some counties Here the LHS is “PCS 12”, a self-reported health measure (previously presented work has focused upon Symptoms). Within-counties (forcing exact matching in some analyses), use matching methods to ‘compare apples to apples’, i.e. to compare any household which uses any cleaner stove with OBSERVATIONALLY SIMILAR household(s) using dirtier. Health outcomes: number of symptoms, probability of specific symptoms, exhaled CO (NEW), forced vital capacity (NEW) 4
SF-12 Survey (a standard tool) • 12 questions -> physical and mental health indices • ongoing work (e.g. Peaody et al.) to examine PCS measures’ correlations with patient quality of life, heart disease, and other health indicators • we use the physical component index formulated from the SF-12 survey (Ware, Kosinski, Keller 1998) • index is standardized from 1 to 100 (avg=50, sd=10) • thus the interpretation of each one point difference is that is equivalent to one-tenth of a standard deviation
Data (including observables for matching) 2001-3 visited 3,500 households in three provinces in China (Shaanxi, Hubei, and Zhejiang -- with five counties in each) From dirtiest to cleanest, fractions of stoves used: Coal (30%), Trad’l Biomass (16%), Improved Biomass (48%), Clean (6%) Information on health outcomes for adults and the household: -based on previous studies about what affects health, which we examine for affecting health & stove uses - age, gender, wealth; smoking behavior; health history - ventilation (measuring number of kitchen openings) - cooking time (Ezzati et al. 2000; Ezzati and Kammen 2001) 11
Findings – policy (limited by data) Significantly Cleaner Stoves Have Benefits If Tests Good • Clean stoves have benefit relative to Traditional Biomass • not clear/strong for Clean vs. Improved, which are closer • not clear/strong within the two Biomass; also are closer • Kirk Smith points out that these data are rather noisy • by the time one breaks down to stove-stove pairings, and dumps counties without enough data to compare, there are significant limitations on getting good tests 6
Findings – method (allocation is critical) Matching (address non-random adoption after the fact) really does matter and we see this in a variety of ways: • for Clean versus Traditional, no impact without matching, as the Clean stoves ended up with ‘sicker’ households • can see the difference in ventilation, in age, in smoking • for Clean versus Improved, do see impact if don’t match, which conveys multiple logics behind non-randomness; not just ‘sickly adoption’ as ‘sicklier’ have the less clean • for Clean versus Coal, apparent damage if don’t address though currently the matching is not attaining ‘balance’ 6
Dar es Salaam Stove Market • 46% charcoal, 43% kerosene, 11% wood/elec • many just use one cooking stove & no warming Tanzania National Census, 2004
KUUTE Stove • 30% more efficient than KCJ (we will test) • Designed by COSTECH (our partnership) • Built by local artisans & know supply chain RAEL
Comparison of CookstovesAverage PM10 Emissions RAEL Ezzati M and D Kammen (2002)
KUUTE Stove Has The SAME: • cooking behavior (as very similar to jiko) • fuel (& thus fuel vendor) • charging (don’t see fire) • size pot, etc. Don’t need to switch cooking behavior. Don’t even need to switch stove vendor.
NOT QUITE OUT THERE YET Jiko la paipu liko wapi? RAEL
Objective: scale-able via info • handing out new stoves misses Demand (unlike the Mobarak & Greenberg sales) • bringing stoves to door to offer for a price could get elasticity but miss actual levels • also, though, need to consider the Supply especially if consider supply interventions; thus we will aim first to work with vendors, providing them information about surplus to see if they disseminate & all respond…
Current Steps • just received 2nd tranch of Blum funding, which helps to resolve what can try now • RA in Dar now being asked to start survey: -collect information on sales & knowledge from vendors (who help find consumers) -collect household consumption by stoves; collect household information for matches -collect baseline information on E(savings)
Possible Module • could randomize prices for another group (currently studying separation of markets) • with Beltramo/Levine (& like Mobarak talk) • price elasticity is policy relevant in of itself • price elasticity could affect vendor markup, so this links to the outcome of information • following prior work on social interactions (deforestation, arsenic), a form of scaling, the price design provide an instrument
SF-12 Survey • In general, would you say your health is: How much does your health limit the following: 2. Moderate activities, such as moving a table, practicing taijiquan, or cleaning windows 3. Climbing several flights of stairs During the past 4 weeks, have you had any of the following problems with your work or other regular daily activities as a result of your physical health? 4. Accomplished less than you like 5. Were limited in the kind of work or other activities
SF-12 Survey (Continued) During the past 4 weeks, have you had any of the following problems with your work or other regular daily activities as a result of your emotional health? 6. Accomplished less than you would like 7. Didn’t do work or other activities as carefully as usual 8. During the past 4 weeks, how much did pain interfere with your normal work? How much of the time during the past 4 weeks 9. Have you felt calm and peaceful? 10. Did you have a lot of energy? 11. Have you felt downhearted and blue? 12. During the past 4 weeks, how much of the time has your physical or emotional health interfered with your social activities?
Methodology Lechner (2002): propensity score matching in multi-treatment setting • Use series of probits to model choice of clean vs. dirty stove • Use propensity scores from probit models to match four controls with a treatment observation • Estimate health impact of improved stove Robustness checks • Kernel smoothing (Heckman, Ichimura, and Todd, 1997) • Covariate matching (CM) (Imbens, 2004) • Additional bias-adjustment when too many covariates and matching not exact (Hill and Reiter, 2006) • Matching performance (covariate balancing, caliper and common support restrictions) 16