Download
1 / 1
10 likes | 149 Views
IMPROVING PREDICTION ACCURACY OF A MAMMAL HABITAT MODEL IN THE HUDSON RIVER VALLEY OF NEW YORK STATE E.A. Hill*, S.D. DeGloria, and M.E. Richmond New York Cooperative Fish and Wildlife Research Unit, Cornell University, Ithaca, NY 14853. Abstract

E N D
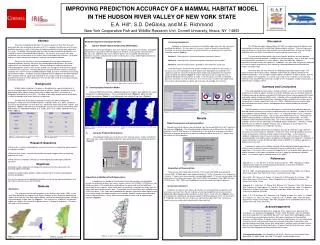
IMPROVING PREDICTION ACCURACY OF A MAMMAL HABITAT MODEL IN THE HUDSON RIVER VALLEY OF NEW YORK STATE E.A. Hill*, S.D. DeGloria, and M.E. Richmond New York Cooperative Fish and Wildlife Research Unit, Cornell University, Ithaca, NY 14853 Abstract Accuracy of predicted distributions for mammal species in New York State was particularly low, only achieving an accuracy of 31.2% statewide. Possible causes of the low prediction accuracy, as well as likely ways to improve prediction accuracy were explored in this study. The wildlife habitat model used to create the original predicted distributions was modified to create refined predicted distributions. Six accuracy assessment trials were conducted using a combination of the original and refined predicted distributions, the original and new mammal observation databases, and two new validation methods. Results of the accuracy assessment indicated that new observational data improved prediction accuracy more than the refined predicted distributions, but neither improvement was statistically significant. Two new methods of validation significantly improved prediction accuracy from 25.75% to 95.8% on average for all 54 mammal species examined in the study area. The low prediction accuracy for mammal species at township resolution was not the result of a flawed prediction model, but rather restricted use of existing observational records. Prediction accuracy improved with the addition of new observed data. New validation methods significantly improved results using existing observed data and provided information at a finer spatial scale that may be more useful for making conservation and land use decisions. Discussion Model Development and Implementation A. Improve Wildlife-Habitat Relationship (WHR) Matrix Workshops were held with biologists from state agencies and academic institutions and wildlife literature was consulted to refine the biophysical variables used to predict mammal habitat. Based on this additional input, each mammal species was associated with land cover, elevation, ecozones, and proximity to water or urban areas using a wildlife-habitat relationship (WHR) model (Table 3). Accuracy Assessment Validation, or accuracy assessment, of the habitat model measures the accuracy of predicted distributions. Six trials were run to assess impact of model mis-specification, restricted use of observational data, and spatial resolution of sampling units using three validation methods (Table 4): Method 1: Township-level: Unobserved species considered “absent.” Method 2: Township-level: Unobserved species considered “missing data.” Method 3: Point-level observations buffered to estimated home range size. Point observations for 30 mammal species (n=908) were used to test the efficacy of accuracy assessment procedures at finer spatial scale. Each point was buffered in the shape of a circle the size of the estimated home ranges and overlaid with the respective species predicted distribution (Figure 7). Buffer intersections with any grid cell(s) of a predicted distribution were counted as a match. If no intersection occurred, the buffered point was counted as an error of omission. As in Trial 5, errors of commission could not be measured as observed data for species absence was not available nor assumed. The GIS-based model implemented by NY-GAP estimated mammal distributions with low prediction accuracy which resulted from flawed validation methods. The use of observed mammal data over a limited time scale and with conservative definitions of what constituted a valid observation resulted in low prediction accuracy and high commission error. The new observed data did not significantly improve prediction accuracy because insufficient new data were obtained. A complete set of observed data, such as atlas data, would have improved the accuracy assessment process. Atlas data collection, however, is impractical, time-consuming, and expensive. In addition, such atlas data are generally collected at a coarser spatial resolution than that required to validate predicted mammal distribution models and output maps. Point-level data are more effective for validating predicted distribution maps. The spatial resolution of the data used for validation should match the spatial resolution of the predicted distributions. If we are able to predict species distributions at 90m resolution, then we should validate such distributions at a similar scale. Data at this resolution can be collected relatively easily using GPS by accessing a number of sites throughout a study area based on a representative sampling scheme. Table 3. Example of wildlife-habitat relationship (WHR) matrix. Background Wildlife habitat modeling is the process of predicting the spatial distribution of a species at variable spatial scales and taxonomic resolutions. Species distributions can be predicted by linking species-habitat information to digital maps within the context of a Geographic Information System (GIS). The ability to accurately predict species distributions is critical to making conservation and land use decisions. The New York State (NYS) Gap Analysis Project (NY-GAP) predicted the distributions of 366 terrestrial vertebrate species statewide (Smith et al. 2001). Prediction accuracy of the distributions for mammals was substantially lower than for birds, reptiles, and amphibians (Table 1) and lower than the prediction accuracy for mammals achieved by other GAP projects as reported by Edwards et al. (1996), Krohn et al. (1998), and Redmond et al. (1998) (Table 2). Summary and Conclusions This study explored possible reasons for poor accuracy assessment results for predicted distributions of mammal species and means by which prediction accuracy could be improved. Predicted mammal distributions created by NY-GAP were refined using an updated GIS model and wildlife-habitat relationship (WHR) matrix. Validation of these predicted distributions was conducted using observed data and three validation methods to determine the likely cause of low prediction accuracy reported by Smith et al. (2001). Additional observed mammal data were collected from various sources and appended to the original database of mammal observations. Statistical analyses of the mammal distributions showed that while additional observed data did improve accuracy assessment, the difference was not significant. In order for the NY-GAP validation method, Method 1 used in Trials 1 – 4, to provide reliable results, a complete database of mammal observations, such as atlas data, would be necessary. The purpose of wildlife habitat modeling is to predict species distributions with minimal effort. The effort needed to collect comprehensive atlas data, such as that available for amphibians, reptiles, and birds, tends to limit the advantages of modeling species distributions. Therefore, it would be better to use a different validation method, such as Method 2 or 3, that requires less observed data to reliably assess prediction accuracy. The only significant improvement in prediction accuracy resulted from using a different accuracy assessment approach. Methods 2 and 3 have shown that high prediction accuracy can be achieved with a relatively limited amount of observed data. As the reliance on computer modeling for natural resources and conservation studies increases, the ability to accurately predict and validate species distributions will become more important. Prediction of species distributions using a GIS-based habitat model and WHR is an effective approach to biodiversity assessment. Coupled with a point-level validation method, GIS-based habitat modeling provides an efficient means to generate species information that can be utilized for a variety of applications. The results of this research will hopefully be of use to public lands agencies and wildlife managers in the region and perhaps serve as a model for subsequent statewide efforts. This research topic is explored further in Hill (2002). • Develop Spatial Prediction Model • Based on WHR enhancements, additional biophysical variables were added to the spatial database for modeling purposes. These included land cover (Figure 2), digital elevation model and ecozones (Figure 3), and hydrography and urban/built-up areas (Figure 4). Table 4. Description of six accuracy assessment trials. Figure 7. Point-level accuracy assessment method used for Trial #6. Results Model Development and Implementation Refined mammal distributions were predicted from the revised WHR for 54 of 57 species in the study area(Figure 8). The refined predicted distributions were different than the original predictions from NY-GAP because of improvements in the land cover and urban area layers. Tabulation of mammal predictions by township indicated a difference of only 17 species from the original NY-GAP predictions. Figure 3. Digital elevation model and ecozone map for the HRV study area. Figure 4. Hydrography and urban areas for the HRV study area. C. Generate Predicted Distributions The prediction model was run for 54 out of 57 mammal species known to inhabit the HRV study area. Refined predicted distributions were generated in map and tabular formats (Figure 5). Table 1. Prediction accuracies for major vertebrate taxonomic groups (Smith et al. 2001). Table 2. Mammal prediction accuracies reported by selected GAP projects. • Research Questions • What factors resulted in low prediction accuracy for mammals: map quality, observed data, or validation methods? • Which of these factors, if enhanced, provides the greatest opportunities for improving prediction accuracy? • What alternative validation methods can be developed to provide higher prediction accuracy? References Edwards, T.C. Jr., E.T. Deshler, D. Forster, and G.G. Moisen. 1996. Adequacy of wildlife habitat relation models for estimating spatial distributions of terrestrial vertebrates. Conservation Biology 10:263-270. Hill, E.A. 2002. Improving prediction accuracy of a mammal habitat model in the Hudson River valley of New York State. M.Sc. Thesis. Cornell University. 138p. Krohn, W.B., R.B. Boone, S.A. Sader, J.A. Hepinstall, S.M. Schaefer, S.L. Painton. 1998. Maine Gap Analysis Final Report. Maine Cooperative Fish and Wildlife Research Unit. University of Maine, Orono. Redmond, R.L., M.M. Hart, J.C. Winne, W.A. Williams, P.C. Thornton, Z. Ma, C.M. Tobalske, M.M. Thornton, K.P. McLaughlin, T.P. Tady, F.B. Fisher, S.W. Running. 1998. The Montana Gap Analysis Project: Final Report. Montana Cooperative Wildlife Research Unit. The University of Montana, Missoula. Smith, C.S., S.D. DeGloria, M.E. Richmond, S.K. Gregory, M. Laba, S.D. Smith, J.L. Braden, E.H. Fegraus, J.J. Fiore, E.A. Hill, D.E. Orgurcak, and J.T. Weber. 2001. New York State Gap Analysis Project: Final Report. New York Cooperative Fish and Wildlife Research Unit, Cornell University, Ithaca, New York. • Objectives • Develop a more comprehensive database of confirmed mammal observations by collecting additional field data. • Refine the wildlife-habitat relations model used by NY-GAP to create new predicted mammal distributions. • Assess the accuracy of the predicted distributions using the new observed database and more robust accuracy assessment methods Figure 8. Example of predicted mammal species distribution map. Acquisition of Observed Data Road surveys were conducted during the summer and fall of 2000, and spring and summer 2001. 810 data points were acquired covering 11 of the 15 counties in the study area. A total of 17 species was observed which included: 689 roadkill; 121 alive in natural habitat; 55 observations from fellow researchers; 542 from NYSDEC fur-take data, 1958-1999; 578 from NYS Museum, 1991- 2000; and 43 additional records extracted from original database. Figure 5. Spatial model for predicting mammal distributions. Acquisition of Additional Field Observations A comprehensive database of confirmed mammal observations was developed through the acquisition of data from various sources such as the NYSDEC, NYS Museum, and fellow researchers. The original observed database was processed to extract additional information for each species. Major roads were systematically surveyed in the study area. All major roads were traveled at least once. The location of each observation was recorded using a GPS instrument. Data sheets were completed with pertinent information and a digital camera was used to record selected observations when needed. Roadkill samples were collected to confirm field identification. County administrative boundaries were used to organize data collection (Figure 6). Methods Study Area The study area included those portions of the Hudson River Valley (HRV) in New York State defined by the Hudson River Estuary Program as the 15 counties bordering the Hudson River from the Troy Dam north of Albany, south to the Verrazano Narrows, including the five boroughs of New York City (Figure 1). The study area is 16,956 km2 and provides habitat for a total of 315 terrestrial vertebrate species, including 28 amphibians, 27 reptiles, 203 birds, and 57 mammals. Accuracy Assessment Prediction accuracy of each species distribution was calculated and averaged for each accuracy assessment trial. Results indicate a clustering of prediction accuracies into two statistically different groups based on Ryan’s Q Test: Trials 1-4 and Trials 5-6 (Table 5). Pair-wise comparisons indicate no statistically significant difference between Trials 1-4 and Trials 5-6. Prediction accuracies for Trials 5 and 6 are significantly higher than Trials 1-4 because commission errors could not be calculated for those two trials. Acknowledgements The following individuals were supportive of this study in many ways and their contributions are gratefully acknowledged: Charles Smith, Bill Brown, and Jennie Braden, New York Cooperative Fish and Wildlife Research Unit; Steve Smith and Magdeline Laba, Institute for Resource Information Systems; Art Lembo, Department of Crop and Soil Sciences, and Mary Killilea, Graduate Field of Soil and Crop Sciences, all units affiliated with Cornell University; and family and friends too numerous to mention. Organizations who provided funding, consulting, advice, data, observations, and peer review included: Hudson River Estuary Program, National Gap Analysis Program, New York State Museum, and the New York State Department of Environmental Conservation. *Corresponding Author: Ms. Elizabeth A. Hill, ESRI – Denver, One International Court, Broomfield, CO 80021-3200, (303) 449-7779 x.8233, e-mail: bhill@esri.com Figure 6. Locations of road survey and mammal species observations. Figure 1. Perspective display of the Hudson River Valley study area. Figure 2. Land cover map of the HRV study area produced by NY-GAP. Table 5. Accuracy assessment results averaged for each trial (n=54).