Download
1 / 21
210 likes | 304 Views
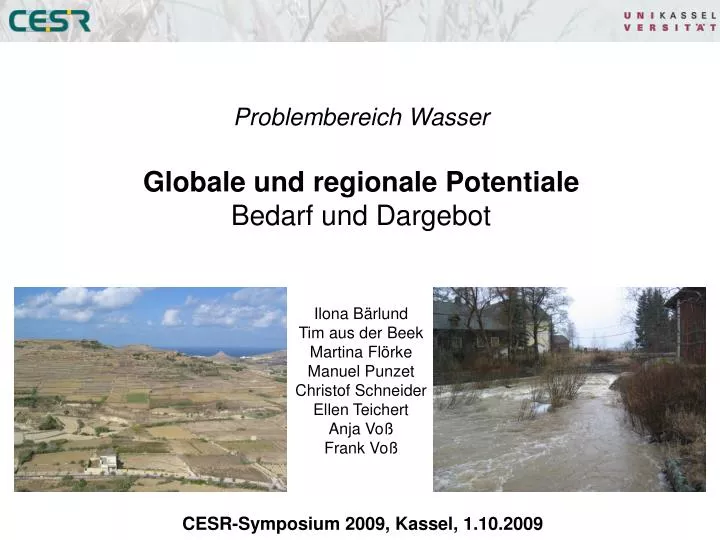
Problembereich Wasser Globale und regionale Potentiale Bedarf und Dargebot Ilona Bärlund Tim aus der Beek Martina Flörke Manuel Punzet Christof Schneider Ellen Teichert Anja Voß Frank Voß. CESR-Symposium 2009, Kassel, 1.10.2009. Einleitung. Startpunkt

E N D
Problembereich Wasser Globale und regionale Potentiale Bedarf und Dargebot Ilona Bärlund Tim aus der Beek Martina Flörke Manuel Punzet Christof Schneider Ellen Teichert Anja Voß Frank Voß CESR-Symposium 2009, Kassel, 1.10.2009
Einleitung • Startpunkt • zu viel und/oder zu wenig Wasser • Gleichgewicht von Wasserdargebot und –nutzung • Sich verändernde Umgebung • Klima • sozio-ökonomische Aspekte • Herangehensweise • Werkzeug mit Komponenten des Wasserhaushaltes • Modellierung und Szenariostudien • unterschiedliche Skalen: Globus, Kontinent, Region, • Einzugsgebiet, Rasterzelle
Globale Studien GEO-4, Global Environment Outlook
Globale Studien GEO-4, Global Environment Outlook
Das Werkzeug WaterGAP – Water, Global Assessment and Prognosis
Globale Studien - WaterMIP Global Hydrological Model Land Surface Hydrological Model Vegetation Model
Globale Studien - WaterMIP Durchfluss, Beispiel Amazonas Amazonas Discharge (m3 s-1)
Modellentwicklung WaterGAP - Hydrologie WaterGAP2 30’ (0.5°) WaterGAP3 5’
Modellentwicklung WaterGAP - Wasserqualität Q0 , C0 Q1 , C1 Cd , qd
Modellentwicklung BSB-Belastung
Szenariostudien & -33% Reduktion im Vergleich zum Referenzjahr
Szenariostudien Klimaänderung - Temperatur
Szenariostudien Narew - Suraz 300 250 200 Q [m3/sec] 150 100 50 0 01.04.65 01.05.65 01.06.65 01.07.65 01.08.65 01.09.65 01.10.65 01.11.65 01.12.65 01.03.65 01.01.66 01.06.66 01.11.64 01.12.64 01.01.65 01.02.65 01.02.66 01.03.66 01.04.66 01.05.66 Date Base IPCM4 MIMR MPEH5 Durchfluss – Beispiel Narew
Fallbeispiel Mittelmeer Abflussbildung (GW + HOF)
Kleiner Ausblick • Herausforderungen • Datenverfügbarkeit und Modelleffizienz • Verknüpfung der Skalen • Land und Wasser • Antworten zu Fragen • Schicksal der Wasserressourcen (hotspots) • Unterstützung von Management & Politik