Download
1 / 18
180 likes | 276 Views
This paper discusses the prioritisation of bulk water services in Sisonke District Municipality using verification exercises and analysis. Learn about challenges faced and lessons learned for effective service delivery.

E N D
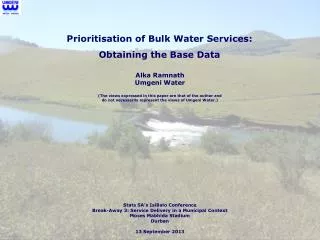
Prioritisation of Bulk Water Services: Obtaining the Base Data AlkaRamnath Umgeni Water (The views expressed in this paper are that of the author and do not necessarily represent the views of Umgeni Water.) Stats SA’s IsiBalo Conference Break-Away 3: Service Delivery in a Municipal Context Moses Mabhida Stadium Durban 13 September 2013
Purpose • The purpose of the overall study was to assess the status of water services and prioritise the provision of bulk water services in Sisonke District Municipality. • The purpose of this paper is to discuss the verification exercise undertaken and how the status of water services were determined.
Thiessen Polygon Analysis on 2009 Eskom Building Count Dataset
The attribute fields were compared with each other to determine if the information correlated. • The attribute information was compared to the Census 2011 (Statistics SA 2012). • Using the comparison of the attribute information, the fields were simplified.
Challenge – At time of exercise, Census 2011 only available at ward level. Density distribution was therefore used.
Results Table 1 Attributes captured per footprint (after Umgeni Water 2012)
Table 2 Access to water source per footprint in KwaSani Municipality (Census 2011 and Eskom 2009).
Table 3 Access to water per footprint in KwaSani Municipality (Census 2011 and Eskom 2009).
Table 4 Access to sanitation per footprint in KwaSani Municipality (Census 2011 and Eskom 2009).
Lessons Learnt • Importance of clear methodology before data capture commences. • Mistrust in the Census data but it is useful and correlates with other datasets in certain situations. • Fallacy of assuming a 1 – 1 relationship between a “building” and a “household”. • Usefulness of the “dwelling unit type” in the Census. • Evidence-based planning, users appear more comfortable with a Building Count dataset – “seeing is believing!”. • To avoid resource waste, need to stop “trying to re-invent the wheel” and need to start using all available datasets together with their methodology reports and their metadata. The failure of datasets to have a proper methodology and this documented is hampering service delivery.