Download
1 / 25
250 likes | 403 Views
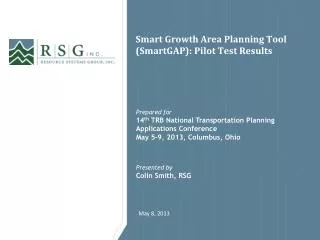
Smart Growth Area Planning Tool ( SmartGAP ): Pilot Test Results. Prepared for 14 th TRB National Transportation Planning Applications Conference May 5-9, 2013, Columbus, Ohio Presented by Colin Smith, RSG. Outline. Project Overview Software

E N D
Smart Growth Area Planning Tool (SmartGAP): Pilot Test Results Prepared for 14th TRB National Transportation Planning Applications Conference May 5-9, 2013, Columbus, Ohio Presented by Colin Smith, RSG
Outline • Project Overview • Software • Smart Growth Area Planning Tool (SmartGAP) • Pilot Tests • Atlanta Regional Commission (ARC) • Maryland Department of Transportation (MDOT • Thurston Regional Planning Commission (TRPC) • Publication Release
Acknowledgements • Work funded by Strategic Highway Research Program Project C16 • Transportation Research Board • Jo Allen Gause, Project Manager • Stephen Andrle, Director • Technical Expert Task Group (TETG) Members • Project Team • RSG • Fehr & Peers • Robert Cervero • Kara Kockelman • Richard Kuzmyak • Agencies Implementing Pilot Tests • Maryland Department of Transportation • Atlanta Regional Commission • Thurston Regional Planning Commission • Open Source Software Platform (GreenSTEP) • Oregon Department of Transportation
SHRP 2 C 16 Project Overview • Purpose • Provide tools, methods, and resources to evaluate smart growth policies on travel demand • Objectives • Understand critical decision points in the transportation planning process and how smart growth approaches affect demand for capacity • Research the dynamics and inter-relationships of smart growth strategies with the performance of a transportation investment • Identify range of features and capabilities that new tools need to represent • Facilitate improved communication, interaction and partnerships between decision-makers and planners in transportation and land use arenas
Key Practitioner Information Needs • Based on interviews with planning officials • Most agencies are interested in scenario planning as a strategy for evaluating smart growth • Develop a regional scenario planning tool • Many agencies need coordination, cooperation, and communication with local governments on land use policy, since land use regulations are governed by local governments • Develop a tool that can be used by land use and transportation planners to provide opportunities for interaction on common goals • Agencies also want to understand • Induced demand, TDM and urban form • Congestion reduction • Outcomes and performance
Software Tool Design • Evaluates regional scenarios • Built environment • Travel demand • Transportation supply • Policies • Considers households and firms individually • Easy to use and freely distributed PLACE TYPES
SmartGAP Process • Synthesizes a list of households and firms in the region • Allocates households and firms to the 13 place types • Tags households with transportation accessibility based on highway supply and transit revenue miles • Simulates household vehicle ownership, vehicles types, and vintages • Simulates the amount of daily travel by each household • Estimates congestion based on the amount of travel demand and the highway supply • Adjusts vehicle ownership and amount of travel based on changes to transportation supply and urban form • Adjusts travel demand and congestion based on policies such as ITS, TDM, pricing • Calculates performance metrics such as VMT, delay, emissions, job accessibility, accidents
Induced Demand and Urban Form Effects on Travel • Predicts the change in VMT for each household due to changes in urban form and the short term induced demand effects of increases in transportation supply. Primary Source: Meta Analysis
Transportation Policies • Predicts the Change in VMT for each Household due to Transportation Policies • Pricing Policies • VMT charges (cents per mile) • Parking pricing based on • Percent of workplace and non-workplace parking that is priced • Parking rates per space • ITS strategies • Percentage of freeways with ITS strategies • Percentage of arterials with ITS strategies Primary Source: GreenSTEP
Travel Demand Management Strategies • Predicts the Change in Work Trip VMT for each Household due to TDM Primary Source: CAPCOA
Model Reports • Community Impacts • Direct Travel Impacts • Environment and Energy Impacts • Financial and Economic Impacts • Location Impacts • Input Summaries
Pilot Test Objectives Four test implementations of the software • Atlanta Regional Commission (ARC) • Thurston Regional Planning Commission (TRPC) • Maryland DOT (region with Maryland/DC area) • RSG tested Portland Metro region Software testing to understand • Usability of the software • Complexity of developing input data • Usefulness of output metrics • Reasonableness of the results Generate feedback that will inform • Final updates to the software and user’s guide • Suggestions for future updates
TRPC: Region Overview Olympia, Washington metropolitan area • Single county, Thurston • 2010 population of 250,000 and 2040 projected population of 425,000 (growth of 69%) • 2010 employment of 130,000 and 2040 project growth of 100%
TRPC: Population and employment Washington Multnomah Clackamas Overall population in the base case is ~65% suburban in 2040, ~20% rural, ~10% CIC and only ~2% urban core Employment is slightly more evenly distributed, with ~50% in suburban, ~25% CIC, and ~15% urban core
TRPC: Population allocation Washington Multnomah Clackamas TRPC moved relatively modest amounts of growth from suburban to close in communities for their land use allocation scenarios Similarly, new residential growth was moved in modest amounts from residential areas to mixed use areas
TRPC: Employment allocation Washington Multnomah Clackamas TRPC was similarly conservative with employment and moved relatively small amounts of growth from suburban to close in communities for their land use allocation scenarios For new employment growth, small amounts were moved from residential areas to mixed use areas
Change in Vehicle Miles and Vehicle Hours Traveled Multnomah Clackamas • VMT is sensitive to changes in demand and supply. The third scenario – adding highway lane miles – increases VMT slightly. Other scenarios – adding transit, or focusing development in central areas – reduces VMT. • VHT responds slightly differently. VMT reductions tend to result in lower VHT, but also policies that reduce congestion can reduce VHT even with no change or an increase in VMT.
Changes in Average Speeds and GHG Emissions Washington Multnomah Clackamas The pattern of reductions in GHG is affected by both change in VMT and also changes in congestion and travel speeds. Congestion reduction through ITS and additional transit provision have the largest impacts on GHG emissions
Transit and Vehicle Trips and Transit Costs Transit Trips Transit Operating Costs Transit Capital Costs Vehicle Trips Washington Multnomah Clackamas Transit trip metric is based on land use effects only: allocating growth to more transit accessible locations (i.e. CIC and mixed use) increases transit use. Operating costs and capital costs are proportion to use so follow the same pattern. Vehicle trips are calculated in a similar way to transit trips – again the calculation is only based on land use effects. Allocating growth to more central and mixed use areas reduces vehicle trips.
Pilot Test Summary • Performance metrics were consistent with expectations • Installation and input file preparation were easy • TRPC were able to run the model across their network to allow multiple users within the MPO to use the same installation • Regional policy scenario testing is useful for • Smaller MPOs and local jurisdictions without advanced travel demand models • Provides a fast way for agencies with good travel demand modeling tools to pre-screen policy scenarios before undertaking extensive travel demand modeling exercises that are resource intensive • Run times are reasonable • Atlanta Regional Commission (ARC) took ~ 1 hour 45 minutes • Thurston Regional Planning Commission (TRPC) took ~ 4 minutes • Maryland DOT (MDOT) took ~17 minutes for Montgomery County and ~2 minutes for Cecil County • RSG Test Bed for Portland Metro Region took ~ 25 minutes
Publications • Prepublication versions are now available! • The final report, SmartGAP user’s guide, and SmartGAP software are now available at: • http://www.trb.org/Main/Blurbs/168761.aspx
MarenOutwater RSG maren.outwater@rsginc.com 414-446-5402 www.rsginc.com Colin Smith RSG colin.smith@rsginc.com 802-295-4999 www.rsginc.com