Download
1 / 56
560 likes | 770 Views
Cross Tabulation and Chi Square Test for Independence. Cross-tabulation. Helps answer questions about whether two or more variables of interest are linked: Is the type of mouthwash user (heavy or light) related to gender?

E N D
Cross-tabulation • Helps answer questions about whether two or more variables of interest are linked: • Is the type of mouthwash user (heavy or light) related to gender? • Is the preference for a certain flavor (cherry or lemon) related to the geographic region (north, south, east, west)? • Is income level associated with gender? • Cross-tabulation determines association not causality.
Dependent and Independent Variables • The variable being studied is called the dependent variable or response variable. • A variable that influences the dependent variable is called independent variable.
Cross-tabulation • Cross-tabulation of two or more variables is possible if the variables are discrete: • The frequency of one variable is subdivided by the other variable categories. • Generally a cross-tabulation table has: • Row percentages • Column percentages • Total percentages • Which one is better? DEPENDS on which variable is considered as independent.
Observed cases Total cases P= Contingency Table • A contingency table shows the conjoint distribution of two discrete variables • This distribution represents the probability of observing a case in each cell • Probability is calculated as:
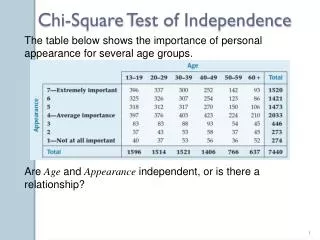
Chi-square Test for Independence • The Chi-square test for independence determines whether two variables are associated or not. H0:Two variables are independent H1:Two variables are not independent Chi-square test results are unstable if cell count is lower than 5
Chi-Square Test Estimated cell Frequency Ri = total observed frequency in the ith row Cj = total observed frequency in the jth column n = sample size Eij = estimated cell frequency Chi-Square statistic x² = chi-square statistics Oi = observed frequency in the ith cell Ei = expected frequency on the ith cell Degrees of Freedom d.f.=(R-1)(C-1)
Awareness of Tire Manufacturer’s Brand Men Women Total Aware 50/39 10/21 60 Unaware 15/2125/1440 65 35 100
X2 with 1 d.f. at .05 critical value = 3.84 Chi-Square Test: Differences Among Groups Example
Chi-square Test for Independence • Under H0, the joint distribution is approximately distributed by the Chi-square distribution (2). Chi-square Reject H0 3.84 2 22.16
Differences Between Groups when Comparing Means • Ratio scaled dependent variables • t-test • When groups are small • When population standard deviation is unknown • z-test • When groups are large
X1 = mean for Group 1 X2 = mean for Group 2 SX1-X2 = the pooled or combined standard error of difference between means. t-Test for Difference of Means
t-Test for Difference of Means X1 = mean for Group 1 X2 = mean for Group 2 SX1-X2 = the pooled or combined standard error of difference between means.
Pooled Estimate of the Standard Error S12 = the variance of Group 1 S22 = the variance of Group 2 n1 = the sample size of Group 1 n2 = the sample size of Group 2
Pooled Estimate of the Standard Errort-test for the Difference of Means S12 = the variance of Group 1 S22 = the variance of Group 2 n1 = the sample size of Group 1 n2 = the sample size of Group 2
Degrees of Freedom • d.f. = n - k • where: • n = n1 + n2 • k = number of groups
Comparing Two Groups when Comparing Proportions • Percentage Comparisons • Sample Proportion - P • Population Proportion -
Differences Between Two Groups when Comparing Proportions The hypothesis is: Ho: P1 = P2 may be restated as: Ho: P1 - P2 = 0
Z-Test for Differences of Proportions p1= sample portion of successes in Group 1 p2= sample portion of successes in Group 2 (p1 - p1)= hypothesized population proportion 1 minus hypothesized population proportion 1 minus Sp1-p2= pooled estimate of the standard errors of difference of proportions
Z-Test for Differences of Proportions p= pooled estimate of proportion of success in a sample of both groups p= (1- p) or a pooled estimate of proportion of failures in a sample of both groups n1= sample size for group 1 n2= sample size for group 2
Analysis of Variance Hypothesis when comparing three groups m1 = m2 = m3
pi= individual scores, i.e., the ith observation or test unit in the jth group pi= grand mean n = number of all observations or test units in a group c = number of jth groups (or columns) Analysis of Variance Sum of Squares
pi= individual scores, i.e., the ith observation or test unit in the jth group pi= grand mean n = number of all observations or test units in a group c = number of jth groups (or columns) Analysis of Variance Sum of SquaresWithin
= individual scores, i.e., the ith observation or test unit in the jth group = grand mean nj= number of all observations or test units in a group Analysis of Variance Sum of squares Between
A Test Market Experiment on Pricing Sales in Units (thousands) Regular Price $.99 130 118 87 84 X1=104.75 X=119.58 Reduced Price $.89 145 143 120 131 X2=134.75 Test Market A, B, or C Test Market D, E, or F Test Market G, H, or I Test Market J, K, or L Mean Grand Mean Cents-Off Coupon Regular Price 153 129 96 99 X1=119.25
ANOVA Summary Table Source of Variation • Between groups • Sum of squares • SSbetween • Degrees of freedom • c-1 where c=number of groups • Mean squared-MSbetween • SSbetween/c-1
ANOVA Summary Table Source of Variation • Within groups • Sum of squares • SSwithin • Degrees of freedom • cn-c where c=number of groups, n= number of observations in a group • Mean squared-MSwithin • SSwithin/cn-c
ANOVA Summary Table Source of Variation • Total • Sum of Squares • SStotal • Degrees of Freedom • cn-1 where c=number of groups, n= number of observations in a group