The Peak-to-Average Power Ratio Problem
650 likes | 2.18k Views
The Peak-to-Average Power Ratio Problem. Gwo-Ruey Lee. Outlines. The Peak-to-Average Power Ratio Problem The Peak-to-Average Power Ratio [1-7] OFDM Signal Amplitude Statistics[4,13] The Distribution of The Peak-to-Average Power Ratio [ 1,4,16] Clipping and Peak Window [1,4,10,11]

The Peak-to-Average Power Ratio Problem
E N D
Presentation Transcript
The Peak-to-Average Power Ratio Problem Gwo-Ruey Lee
Outlines • The Peak-to-Average Power Ratio Problem • The Peak-to-Average Power Ratio [1-7] • OFDM Signal Amplitude Statistics[4,13] • The Distribution of The Peak-to-Average Power Ratio [ 1,4,16] • Clipping and Peak Window [1,4,10,11] • Clipping Amplifier Methods • Clipping Amplifier Simulations • Peak Cancellation [1,4,8,9,14,15] • PAP Reduction Codes [14,17,18.19] • Symbol Scrambling [12,14,20,21]
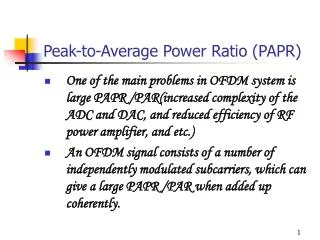
The Peak-to-Average Power Ratio Problem 1/3 • It is plausible that the OFDM signal - which is the superposition of a high number of modulated subchannel signals – may exhibit a high instantaneous signal peak with respect to the average signal level. • An OFDM signal consists of a number of independently modulated subcarriers, which can give a large peak-to-average power (PAP) ratio. • High peak-to-average power ratio • Problem 1. It increased complexity of the analog-to-digital and digital-to-analog converters • Problem 2. It reduced efficiency of the RF power amplifier • The PAPR puts a stringent requirement on the power amplifier and reduces the efficiency in the sense that a higher input backoff factor is needed before the peaks in the signal experience significant distortion due to power amplifier nonlinearity.
The Peak-to-Average Power Ratio Problem 2/3 PAPR ~ number of subcarriers =N
The Peak-to-Average Power Ratio Problem 3/3 • The existing solutions of PAPR • 1. Signal distortion techniques,which reduce the peak amplitudes simply by nonlinearly distorting the OFDM signal at or around the peaks. • Clipping • Peak window • Peak cancellation • 2. Coding techniques that using a special forward-error correct code • PAP reduction code • 3. It is based on scrambling each OFDM symbol with different scrambling sequences and selecting that sequence that gives the smallest PAP ratio. • Adaptive subcarrier selection (ASUS) • Selected mapping (SLM) • Partial transmit sequence (PTS)
The Peak-to-Average Power Ratio 1/17 • Signal expression • Let and denote the real and imaginary parts of the output signal. • A complex baseband signal, defined over the time interval , can be expressed as • where is the complex data of the kth subcarrier and is the OFDM symbol period.
The Peak-to-Average Power RatioPAPR Definition 2/17 • OFDM bandpass signal • is the carrier frequency of RF signals. • The peak power is defined as the power of a sine wave with an amplitude equal to the maximum envelope value. • The PAPR of the baseband OFDM signals can be defined as
The Peak-to-Average Power Ratio 3/17 • If all the subcarrier are modulated by phase-shift keying (PSK), the theoretical upper bound of the PAPR in OFDM signals with N subcarriers is N. • For example • It can be shown that for an M-ary PSK OFDM system, there are at most patterns that yield the highest PAPR, namely, N. • The probability of observing such a PAPR is .
The Peak-to-Average Power Ratio 4/17 • Basic waveforms of OFDM signal with 4-DFT BPSK
The Peak-to-Average Power Ratio 5/17 • OFDM signal with 4-DFT BPSK
The Peak-to-Average Power Ratio 6/17 The histogram of peak amplitude of 4-DFT BPSK
The Peak-to-Average Power Ratio 7/17 4-DFT QPSK with max peak amplitude
The Peak-to-Average Power Ratio 8/17 • 4-DFT QPSK
The Peak-to-Average Power Ratio 9/17 The histogram of peak amplitude of 4-DFT QPSK
The Peak-to-Average Power Ratio 10/17 • N-point DFT M-ary PSK • It can be shown that for an M-ary PSK OFDM system, there are at most patterns that yield the highest PAPR, namely, N. • The probability of observing such a PAPR is .
OFDM Signal Amplitude Statistics 11/17 • The time domain OFDM signal is constituted by the sum of complex exponential functions, whose amplitudes and phases are determined by the data symbols transmitted over the different carriers. • Assuming random data symbols, the resulting time domain signal exhibits an amplitude probability density function (PDF) approaching the two-dimensional or complex Gaussian distribution for a high number of subcarriers. • Figure listed below explicitly shows that the measured amplitude histogram of the (a) in-phase component/Quadrature component and (b) amplitude of the a 256-subcarrier OFDM signal obeys a (a) Gaussian distribution and (b) Rayleigh distribution with a standard deviation of .
OFDM Signal Amplitude Statistics 12/17 • The observed amplitude histogram of the 256-subcarrier OFDM signal is correspond to Rayleigh distribution. • Note that the standard deviation of the probability density function is independent of the number of subcarriers employed, since the mean power of the signal is normalized to 1.
OFDM Signal Amplitude Statistics 13/17 • The distribution of I/Q component and amplitude (a) in-phase component/Quadrature component histogram (b) Amplitude histogram
OFDM Signal Amplitude Statistics 14/17 The distribution of Measured amplitude which the value is large than threshold Signal Amplitude CDF
The Distribution of The Peak-to-Average Power Ratio 15/17 • For one OFDM symbol with N subcarrier, the complex baseband signal can be written as • For large N, the real and imaginary values of become Gaussian distributed, each with a mean of zero and a variance ½. • The amplitude of the OFDM signal therefore has a Rayleigh distribution, while the power distribution becomes a central chi-square distribution given by
The Distribution of The Peak-to-Average Power Ratio 16/17 • Cumulative distribution function • Assuming the samples are mutually uncorrelated – which is true for non-oversampling – the probability that the PAPR is below some threshold level can be written as • Assuming the distribution of N subcarriers and oversampling can be approximated by the distribution for subcarriers without oversampling with larger than one.
The Distribution of The Peak-to-Average Power Ratio 17/17 • PAPR distribution without oversampling for a number of subcarriers of (a) 16 (b)32 (c) 64 (d) 128 (e) 256 and (f) 1024
Clipping and Peak Window 1/6 • Clipping the signal • The simplest way to reduce the PAPR • The peak amplitude becomes limited to some desired level • By distorting the OFDM signal amplitude, a kind of self-interference is introduced that degrades the BER. • Nonlinear distortion increases out-of-band radiation • Peak windowing • To remedy the out-of-band problem of clipping • To multiply large signal peaks by nonrectangular window • To minimize the out-of-band interference, ideally the window should be as narrowband as possible. • The windows should not be too long in the time domain, because that implies that many signal samples as affected, which increases the BER.
Clipping Amplitude Methods 2/6 • Clipping – a example of reducing the large peaks in OFDM with the use of windowing
Clipping Amplitude Methods 3/6 • The difference between clipping the signal and windowing the signal
Clipping Amplitude Methods 4/6 • The spectral distortion can be decreased by increasing the windowing
Clipping Amplitude Simulations 5/6 Symbol error rate versus Eb/N0 in AWGN. OFDM signal is clipped to PAPR of (a) no distortion (b) 5 (c) 3 and (d) 1 dB.
Clipping Amplitude Simulations 6/6 Symbol error rate versus Eb/N0 in AWGN. Peak windowing is applied with a window width of 1/16 of the FFT duration.
Peak Cancellation 1/7 • The undesired effect of nonlinear distortion can be avoided by doing a linear peak cancellation technique, whereby a time-shifted and scaled reference function is subtracted from the signal, such that each subtracted reference function reduced the peak power of the least one signal sample. • By selecting an appropriate reference function with approximately the same bandwidth as the transmitted signal, it can be assured that the peak power reduction does not cause any out-of-band interference. • Peak cancellation can be done digitally after generation of the digital OFDM symbols.
Peak Cancellation 2/7 • The peak cancellation was done after parallel-to-serial conversion of signal.
Peak Cancellation 3/7 • The peak cancellation is identical to clipping followed by filtering • Supposed the clipped signal is filtered by an ideal LPF with impulse response of . • are the amplitude, phase, and delay of the correction that is applied to the ith sample in order to reach the desired clipping level.
Peak Cancellation 4/7 • It is also possible to do the cancellation immediately after the IFFT that is done on a symbol-by-symbol basis. • An efficient way to generate the cancellation signal without using a stored reference function is to use a lowpass filter in the frequency domain.
Peak Cancellation 5/7 • It shows an example of the signal envelopes of one arbitrary OFDM symbol and corresponding reference signal. (a) OFDM symbol envelope (b) corresponding reference signal envelope
Peak Cancellation 6/7 • After subtraction, the peak amplitude is reduced to a maximum of 3dB above the RMS value. (a) OFDM symbol envelope (b) signal envelope after peak cancellation
Peak Cancellation 7/7 • Simulated power spectral densities of an OFDM system with 32 carriers by using peak cancellation technique (a) undistorted spectrum, PAPR=15dB (b) spectrum after peak cancellation to PAPR=4dB (c) clipping to PAPR =4dB
PAP Reduction Codes 1/7 • Coding techniques that using a special forward-error-correction code • Golay complementary sequence • Linear block code [17,18]
PAP Reduction CodesGolay complementary sequence 2/7 • Golay complementary sequence • Golay complementary sequences are sequence pairs for which the sum of auto-correlation function is zero for all delay shifts unequal to zero. • The correlation properties of complementary sequences translate into a relatively small PAPR of 3 dB when the codes are used to modulate an OFDM signal.
PAP Reduction CodesGolay complementary sequence 3/7 • For this case of 16 channels, the PAPR is reduced by approximately 9 dB in comparison with the uncoded case. (a) Square root of PAPR for a 16 channel OFDM signal, modulated with the same initial phase for all subcarrier ((b) Square root of PAPR for a 16 channel OFDM signal, modulated with a complementary code.
PAP Reduction CodesLinear block code 4/7 • Linear block code[17,18] • A block coding scheme provides error correction capability, and also achieves the minimum PAPR for the OFDM system utilizing QPSK modulation and 4 subcarriers. • Block coding approach : by selecting only those codewords with small PAPR. Well-designed block codes provide error correction capability.
PAP Reduction CodesLinear block code 5/7 • Block diagram of the OFDM signal with the proposed block coding scheme • The 8 bit vector x becomes 4 complex anti-podal symbols
PAP Reduction CodesLinear block code 6/7 (a) Instantaneous power of an uncoded OFDM system with BPSK modulation and N=4 subcarriers. (b) Instantaneous power of an uncoded OFDM system employing the block coding scheme.
PAP Reduction CodesLinear block code 7/7 • Instantaneous power of an uncoded OFDM system with BPSK modulation and N=4 subcarriers.
Symbol Scrambling 1/10 • The basic idea of symbol scrambling is that for each OFDM symbol, the input sequence is scrambled by a certain number of scrambling sequence, and the output signal is transmitted with the smallest PAPR. • Symbol scrambling techniques • Adaptive subcarrier selection • With the subcarrier allocation scheme • Selected Mapping (SLM) • The transmitter selects one favorable transmit signal from a set of sufficiently different signals which all represent the same information. • Partial Transmit Sequence (PTS) • The transmitter constructs its transmit signal with low PAR by coordinated addition of appropriately phase rotated signal parts. • The difference between SLM and PTS is that the first applies independent scrambling rotations to all subcarriers, while the latter only applies scrambling rotations to group of subcarriers.
Symbol Scrambling - ASUS 2/10 • OFDM system using ASUS (adaptive subcarrier selection) [20,21]
Symbol Scrambling - SLM 3/10 • Selected Mapping (SLM) • Generate U transmit sequences , representing the same information for each OFDM symbols. • Select the lowest PAPR in time-domain of U sequences to transmit • Define U distinct vectors , , (number of subcarriers) , . • Each OFDM frame is multiplied carrierwise with U vectors:
Symbol Scrambling - SLM 4/10 • Selected Mapping (SLM)
Symbol Scrambling - SLM 5/10 • Selected Mapping (SLM) • SLM requires U IDFT’s in the transmitter, while the receiver still needs only one DFT. • bits are required to explicitly represent the side information. • Moderate complexity. • For arbitrary number of carriers and any signal constellation. • Distortionless.
Symbol Scrambling - SLM 6/10 • Performance of SLM • Known side information
Symbol Scrambling - PTS 7/10 • Partial Transmit Sequence (PTS) • The information bearing subcarrier block is subdivide into V pairwise disjoint carrier subblocks . • All subcarrier positions in which are already represented in another subblock are set to zero . • Rotation factor for each subblock v and the modified subcarrier vector represents the same information as . • The subblocks are transformed by V separate IDFTs. • Choose the rotation factor that minimize PAPR. • Optimum transmitted sequence .
Symbol Scrambling - PTS 8/10 • Partial Transmit Sequence (PTS)