Download
1 / 6
60 likes | 323 Views
Global Solar Power Map #1 W orldwide solar power average Peak Sun Hours. India Solar Report. Population 1.3 Billion in 2000 Area 1/3 of USA Economic Growth 7-8% per Year 300 Sunny days per year 450 Million People without Electricity, use Kerosene / other fuels, 60,000 villages

E N D
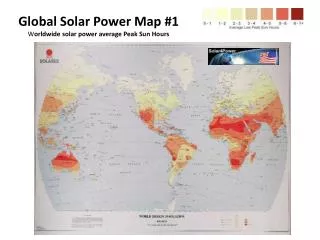
Global Solar Power Map #1Worldwide solar power average Peak Sun Hours
India Solar Report • Population 1.3 Billion in 2000 • Area 1/3 of USA • Economic Growth 7-8% per Year • 300 Sunny days per year • 450 Million People without Electricity, use Kerosene / other fuels, 60,000 villages • Electrical Energy Consumption 660 kWh per capita ( <10% of USA, <25% of world average ) • Grid Power Supply Demand gap 10% with 150 GW (2008) • Global Solar Power Map #14India and Indian Ocean Semi PV Group White Paper – The Solar PV Landscape in India April 2009
India Solar Mission 2020 • National Solar Mission • Solar Power Target 20 GW by 2020 • 1-1.5 GW by 2012 • 20 GW by 2020 • India Investment $20B for 30 Year Plan • Rajasthan set 35,000 km2 area for Solar
India Solar System Uses 2009 • Street Lighting System: 54,795 • Residential Home Lighting System: 434,692 • Solar Lanterns: 697,419 • Solar Water Heating Systems: 140 km2 of collector area • Solar Photovoltaic Water Pumps: 200-3K Watt Pump uses < 1.8KW Panels – installed 7148. • Solar Photovoltaic Power Plants: 2.12 MW • Ref: The Solar PV landscape in India - PV Group Market white paper, April 2009.
PV Manufacturers (Cells, Modules and Integrators) in India • Tata BP Solar Ltd • Central Electronics Ltd • Bharat Electronics Ltd • Bharat Heavy Electricals Ltd • Solar Semi Conductors Ltd • XL Energy & Telecom Ltd • Webel SL Energy Ltd • USL Photovoltaics Ltd • Waaree Energies Ltd. Surat, Gujrat • Titan Energy Systems Ltd. Hydrabad, AP • SHARP • Moser-Baer ( Applied Materials Line) • Oerlikon Solar India • Reliance Industries- Solar Energy Division • Signet Solar • Nav Semi Suntechnics Ltd. Photon Energy Systems Ltd Premier Solar Systems Ltd Titan Energy Systems Ltd Rashmi Industries Alpex Solar Ltd Micro Sun Solar Gitanjali Solar Nest Energy (small panels) Access Solar Thrive Energy and many more.
India Solar Job Opportunity • US PV industry employs 20,000 direct and 100,000 Indirect employees, expected 150,000 by 2020. • Germany employs 42,000 in PV industry • European Study-- 25-30 direct job, 5-10 indirect job per MW PV installed • India Expects 100,000 jobs in PV industry • Current model - manufacture in India sell to Europe + Internal Market • Many US companies operating in India • Govt providing large subsidies - 35 Cents per Kilo watt Hour Subsidy, Deemed unsupportable in long term • $20B investments • New Solar Projects list with Subsidies • Mission 2020 goals seems too optimistic without additional private industry incentives